Playbooks
What Is a Good ROAS? The Real Answer Is Your Margin
A 'good' ROAS isn't a number anyone can hand you. It's your break-even point, set by your margin, plus however much profit you want above it.

A good ROAS is any return on ad spend above your break-even point, and your break-even point is 1 divided by your gross profit margin. A business running a 50% margin breaks even at 2:1 and turns a profit above that. A business running a 20% margin needs 5:1 just to get to zero. The “2:1 to 4:1 is a good ROAS” advice you’ll find everywhere only holds for businesses whose margins happen to sit in the 25-50% range, which is a coincidence of averages, not a rule.
Key takeaways
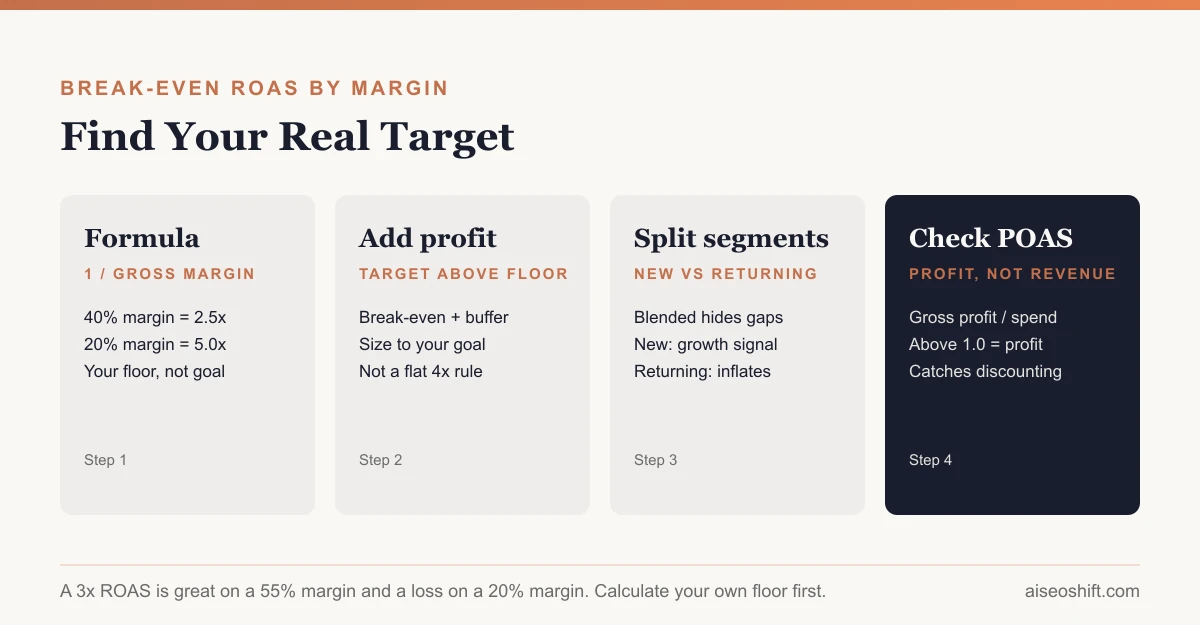
- Break-even ROAS = 1 / gross margin (as a decimal). A 40% margin breaks even at 2.5:1.
- “Good” ROAS has to clear break-even plus whatever profit margin you want on top. There’s no fixed good number across businesses.
- Blended ROAS hides the gap between new and returning customers. Split them to see if paid spend is actually growing your business.
- MER (total revenue / total marketing spend) catches problems that channel-level ROAS can miss.
- POAS (profit on ad spend) answers the question ROAS can’t: did this spend make you money, not just revenue.
What ROAS actually measures
ROAS is revenue generated divided by the amount spent to generate it. Spend $1,000 on ads, generate $4,000 in revenue from those ads, and your ROAS is 4:1, or 400%.
That’s the whole formula. The problem isn’t the math, it’s that revenue isn’t profit, and a universal “good” number implies every business has the same costs underneath that revenue. They don’t.
The break-even ROAS formula
Break-even ROAS tells you the minimum return that gets you to zero, not to profit. The formula:
Break-even ROAS = 1 ÷ gross profit margin (as a decimal)
| Gross margin | Break-even ROAS |
|---|---|
| 20% | 5.0:1 |
| 25% | 4.0:1 |
| 30% | 3.3:1 |
| 40% | 2.5:1 |
| 50% | 2.0:1 |
| 60% | 1.7:1 |
| 70% | 1.4:1 |
Worked example
Say you run a hypothetical $40 skincare product with a 55% gross margin after cost of goods, packaging and payment processing fees. Your gross profit per unit is $22.
Your break-even ROAS is 1 ÷ 0.55 = 1.82:1. Spend $100 on ads, generate $182 in revenue from that spend, and you’ve broken even, not turned a profit, because $100 of that $182 in revenue is covering the ad cost and the rest is covering the cost of the product itself.
To hit a 20% profit margin on top of your ad spend specifically, you’d want your ROAS to clear roughly 2.3-2.4:1 at this margin level, giving you room above break-even for actual profit. A platform-reported ROAS of 3:1 on this product is genuinely good. A ROAS of 3:1 on a product with a 15% margin would be close to break-even and might be losing money once you account for returns, overhead and anything not captured in “gross margin.”
Why “good” depends on margin, and on new vs. returning customers
Two businesses can report the same 3:1 ROAS and be in completely different positions.
Margin changes everything. A software company with an 80% gross margin can be wildly profitable at a 2:1 ROAS most ecommerce brands would consider mediocre. A low-margin grocery or commodity product might need 6:1 or higher just to clear break-even once shipping and fulfillment costs are factored in.
Blended ROAS hides the acquisition problem. Most ad platforms report ROAS blended across your whole customer base, which mixes brand-new customers (expensive to acquire, lower initial order value) with returning customers (cheap to re-engage, often responding to a retargeting ad for something they were already going to buy). A blended 4:1 ROAS might really be a weak 2:1 on new customers propped up by a strong 8:1 on returning ones. If growth is the goal, that distinction matters more than the blended number.
| Segment | Typical pattern |
|---|---|
| New customers | Higher cost to acquire, lower ROAS, drives growth |
| Returning customers | Lower cost to re-engage, higher ROAS, drives revenue stability |
| Blended | Averages the two, can mask a growth problem |
A business optimizing purely for blended ROAS can end up shifting budget away from new-customer acquisition toward retargeting existing buyers, because retargeting always looks like the better ROAS. That’s a reasonable short-term move and a real problem if it continues for a year and growth stalls.
ROAS vs MER vs POAS
These three metrics answer different questions, and conflating them is where most “is my ROAS good” confusion comes from.
| Metric | Formula | What it answers |
|---|---|---|
| ROAS | Revenue from ads ÷ ad spend | Was this specific campaign or channel efficient? |
| MER | Total revenue ÷ total marketing spend | Is the whole marketing function efficient, account for account? |
| POAS | Gross profit ÷ ad spend | Did this spend actually make money, not just revenue? |
MER catches a problem channel-level ROAS can miss: if you’re running five channels and each reports a decent individual ROAS, but total revenue divided by total spend across all five comes out weak, something is being double-counted or over-attributed at the channel level. MER forces a company-wide efficiency check that individual platform dashboards, which all want to take credit for the same sale, won’t give you.
POAS fixes the gap between ROAS and actual profitability. POAS = gross profit ÷ ad spend, where gross profit already has cost of goods, fulfillment and payment fees backed out. A POAS above 1.0 means the ad spend generated more profit than it cost; below 1.0 means it didn’t, even if the ROAS number looked fine. Of the three, POAS is the one that should decide whether to scale a campaign, because it’s the only one measuring money you actually keep.
A rough industry benchmark, if you want one
Industry benchmark numbers vary enormously depending on who ran the study and what counts as “ad spend” in their dataset, so treat any single figure as directional, not a target. Analytics firm Varos published 2025 median ROAS by category that, as reported by Landingi, range from around 6.1x for toys down to around 2.2x for healthcare on Google Ads, with a wider and less consistent spread on Meta, where some categories (books, in that dataset) sat below 1.0x. The wide range itself is the useful data point: it confirms that a flat “aim for 4:1” rule ignores how much margin and category variance actually matters.
Your own break-even ROAS, calculated from your own margin, will always be a more reliable target than someone else’s industry median.
A second worked example: a lower-margin business
Margin differences get clearer with a contrast. Say you run a hypothetical meal-kit subscription with a 22% gross margin after ingredients, packaging and shipping, numbers that run tighter than most physical products because of cold-chain logistics.
Break-even ROAS here is 1 ÷ 0.22, or about 4.5:1. A platform dashboard showing 3:1 ROAS on this business, which would look strong for the skincare example above, is actually losing money on every dollar of ad spend once the real cost of goods is backed out. To hit the same 20%-above-break-even target as the skincare example, this meal-kit business would need closer to 5.5:1, nearly three times the ROAS the skincare brand needed for the same profit outcome.
This is the part that gets lost when a benchmark article says “aim for 3-4x.” Both businesses could be running identical ad creative, identical targeting and identical conversion rates, and one would be profitable while the other burns cash, purely because of what’s underneath the revenue line.
Where ROAS breaks down as the only metric
ROAS answers “was this spend efficient relative to revenue.” It doesn’t answer a few other questions that matter just as much:
Does the customer come back? A ROAS calculated only on first purchase ignores lifetime value entirely. A channel with a mediocre first-order ROAS but customers who reorder three times in the next year can be a better long-term bet than a channel with a great first-order ROAS and no repeat behavior. If this is a live question for your spend, pairing ROAS with a customer acquisition cost and lifetime value view fills the gap.
What’s the attribution window doing to the number? A 30-day click attribution window will report a higher ROAS than a 7-day window for the same spend, simply because it’s crediting more of the revenue that happened anyway to the ad. Compare ROAS across campaigns or platforms only when the attribution window and model are the same on both sides, or the comparison is meaningless.
Is discounting inflating the revenue side? A campaign running alongside a 30% storewide discount will often show a higher ROAS than the same campaign at full price, because more people buy, but the margin per order just dropped, which means the break-even ROAS for that period went up even as the reported ROAS went up too. Checking POAS during promotional periods catches this; checking ROAS alone usually doesn’t.
Using this in practice
Three steps to turn this into something you actually use:
- Calculate your break-even ROAS using your real gross margin, not your revenue growth target. If you don’t know your margin precisely, use a conservative estimate and tighten it later.
- Set your target ROAS above break-even, with the gap sized to the profit margin you want from ad spend specifically, separate from the margin on the product itself.
- Split new vs. returning customer ROAS at least roughly, even if your platform’s native reporting makes this annoying to pull. Decide what you’re actually optimizing for before you read the blended number as a verdict.
If you’re building out the measurement section of a broader plan, our marketing plan template has a KPI table built for exactly this, and our piece on marketing mix modeling covers how to measure efficiency across channels when single-channel ROAS and MER start disagreeing with each other. For the budget tradeoffs that decide how much gets spent on paid in the first place, see a full-funnel performance marketing system.
The bottom line
Stop asking what ROAS is good in general. Ask what your break-even ROAS is, based on your actual margin, then decide how much profit above that you want ad spend to deliver. A 3:1 ROAS is excellent on a high-margin product and barely break-even on a low-margin one. The number that matters isn’t the one on the dashboard, it’s the one you calculate from your own numbers before you ever look at the dashboard.
Related guides
- LTV:CAC Ratio: Formula, Benchmark and Worked Examples
- Customer Acquisition Cost: Formula, Examples and How to Lower It
- Incrementality Testing: How to Know Your Ads Actually Work
- Marketing Budget Allocation: A Practical Framework for 2026