Playbooks
Marketing Mix Modeling, Explained Plainly (With Free Tools)
MMM answers a question pixel-based attribution can't: how much did each channel actually contribute, once you strip out seasonality and price.


Marketing mix modeling (MMM) is a statistical method that uses your historical sales, marketing spend by channel, pricing and outside factors like seasonality to estimate how much each channel actually contributed to sales. Unlike attribution, which tracks individual clicks and touchpoints, MMM works on aggregated data over months or years, which makes it slower to set up but far less dependent on the kind of user-level tracking that’s gotten harder since iOS tracking changes and cookie restrictions.
Key takeaways
- MMM is correlative, estimating each channel’s statistical contribution to sales, not a direct causal measurement like a true experiment.
- It needs real data: most guidance points to at least two years of weekly spend and sales data across multiple channels for stable results.
- Meta’s Robyn and Google’s Meridian are both free, open-source MMM packages, as of October 2026.
- MMM, attribution and incrementality testing answer different questions; mature measurement setups tend to use more than one.
- A commonly cited rough floor for MMM to produce stable results is tens of thousands of dollars a month in multi-channel ad spend. Below that, simpler methods usually make more sense.
What MMM is actually doing under the hood
At its core, MMM is a regression problem. You feed it weekly (ideally) time series of your sales or revenue, your spend by channel, your pricing, your promotions, and relevant outside variables like holidays or weather if they matter to your category. The model then estimates a coefficient for each input: how much of the variation in sales that input explains, after controlling for the others.
Two concepts show up in almost every MMM write-up:
- Adstock. The idea that an ad’s effect doesn’t end the moment someone sees it; it decays over following weeks. The model estimates that decay curve per channel.
- Saturation (diminishing returns). The idea that each additional dollar in a channel produces less incremental sales than the last, especially once you’re already spending heavily there. The model estimates where that curve bends for each channel.
Put those two together and you get something useful for budget planning: not just “which channel worked,” but “where does this channel start returning less for each extra dollar,” which is the actual question behind a budget reallocation decision.
MMM vs. attribution vs. incrementality testing
These three get lumped together constantly, and they answer genuinely different questions.
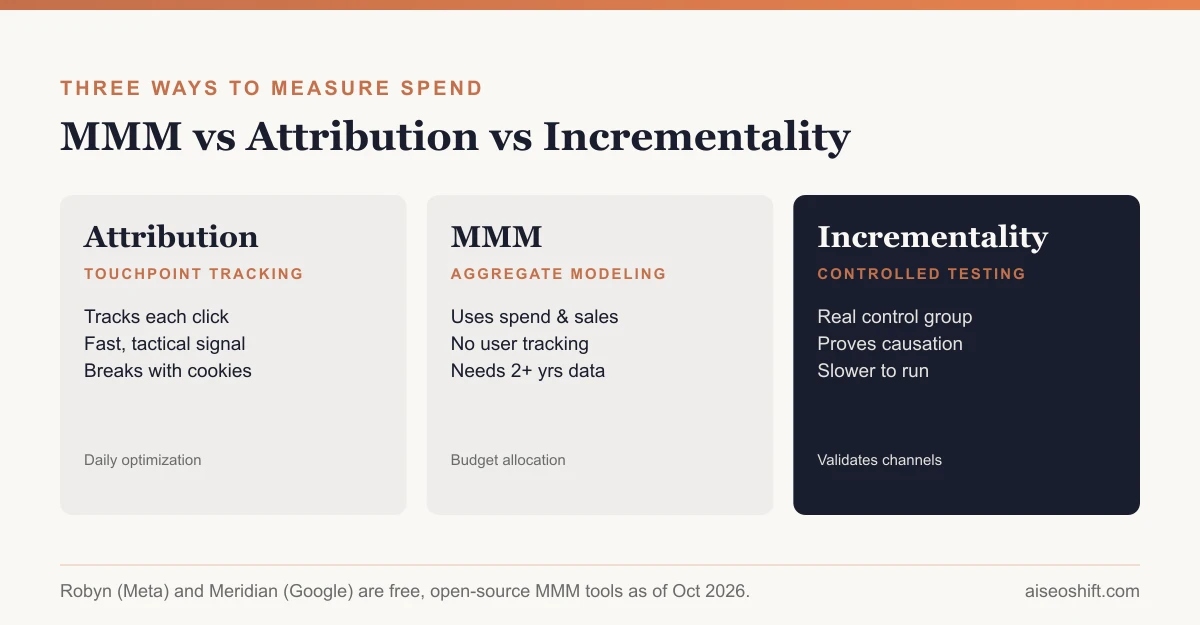
| Method | What it measures | Strength | Weakness |
|---|---|---|---|
| Attribution (multi-touch) | Which touchpoints a converting customer encountered | Fast, granular, good for day-to-day optimization | Correlation, not causation; breaks down as tracking gets harder |
| Marketing mix modeling | Each channel’s statistical contribution to aggregate sales over time | Doesn’t rely on user-level tracking; good for strategic budget allocation | Needs lots of historical data; still correlative, not a true experiment |
| Incrementality testing | The causal, counterfactual impact of a channel, via a real control group | The most rigorous evidence that a channel caused the lift | Slower to run, needs a cleanly isolated test, not always practical for every channel |
Measured’s own comparison frames it directly: attribution gives fast tactical signal on what happened after a click, MMM estimates each channel’s contribution at a strategic level, and incrementality testing proves what your marketing actually caused. None of the three replaces the others; they sit at different speeds and different levels of rigor.
A practical way to think about it: use attribution to react this week, use incrementality tests to validate your biggest, most expensive channel assumptions a few times a year, and use MMM to decide how to split next quarter’s budget across the whole mix.
When a brand actually needs MMM
MMM isn’t free to set up well, even with open-source tooling, because the real cost is the data engineering and the time to validate the model, not a software license. A few signals that it’s worth the investment:
- You run paid media across several channels at meaningful scale. Guidance varies by source, but figures cited in MMM vendor content put a rough floor around tens of thousands of dollars a month in multi-channel spend before the model has enough signal-to-noise to produce stable channel coefficients.
- You have at least two years of weekly data, and ideally more. Seasonality needs at least two full cycles to separate from channel effects reliably; shorter windows tend to produce unstable results.
- Attribution has stopped giving you a full picture, often because of iOS tracking limits, ad blockers, or a shift toward channels (TV, podcasts, out-of-home) that attribution can’t track at all.
- You’re making six-figure-or-larger budget decisions where being wrong about a channel’s real contribution is expensive enough to justify the modeling effort.
If none of that applies yet, a simpler holdout test (turning a channel off in one region and comparing to a matched region) often answers the immediate question more cheaply than standing up a full MMM pipeline.
Two free, open-source options
As of October 2026, the two most-discussed open-source MMM packages come from the two companies with the most paid-media data in the world.
Meta Robyn. Robyn is Meta Marketing Science’s open-source package, built to “democratize modeling knowledge” per its own GitHub description. It uses ridge regression plus a multi-objective evolutionary algorithm to tune hyperparameters, and handles adstock and saturation curves automatically so a data team doesn’t have to build those from scratch. It’s available in R, with a newer, LLM-translated Python version that Meta itself flags as beta and more bug-prone.
Google Meridian. Meridian uses Bayesian inference rather than Robyn’s frequentist approach, and works at the geo level to forecast ROI and calibrate against real experiments. Google made it globally available in January 2025 after testing it with a range of brands, and added a no-code Scenario Planner interface in February 2026 for budget modeling without touching Python directly. It’s built to integrate with Google Cloud tools like BigQuery and Vertex AI, which matters if that’s already your data stack.
Neither tool charges a license fee. What you pay for is the data preparation, the statistics expertise to set priors (for Meridian’s Bayesian approach) and validate outputs, and the infrastructure to run the models, which is real cost even if the software itself is free.
A simple MMM readiness checklist
Use this before deciding whether to build or buy a model:
[ ] 2+ years of weekly sales/revenue data, ideally 3+
[ ] Weekly spend by channel, for every channel you want measured
[ ] Pricing and promotion history for the same period
[ ] Enough spend variation per channel (not a flat weekly budget)
[ ] 5+ channels running simultaneously with meaningful spend in each
[ ] A data team or partner who can validate the model, not just run it
[ ] A specific budget-allocation decision the output will inform
If most of those boxes are unchecked, that’s not a reason to abandon measurement, it’s a signal to start with attribution hygiene and a couple of incrementality tests first, then revisit MMM once the data history exists.
How this fits your broader measurement stack
MMM works best as one layer in a bigger measurement plan, not a replacement for the tracking you already have. If your tracking setup is shaky to begin with, fix that before adding a strategic model on top of it; our notes on building a full-funnel performance marketing system cover the groundwork most teams skip. And if the real goal behind the measurement work is budget allocation, pairing MMM output with a marketing plan template gives you somewhere concrete to put the recommendation into action, the same way we laid out channel priorities in our Black Friday marketing ideas timeline.
A hypothetical example of reading MMM output
Say a $20 million revenue DTC brand runs paid social, paid search, email and a seasonal TV test, and commissions an MMM study on two years of weekly data. A simplified version of what the output might show:
| Channel | Estimated contribution to sales | Saturation point |
|---|---|---|
| Paid search | 18% | Already near saturation at current spend |
| Paid social | 22% | Room to grow before diminishing returns kick in |
| 9% | Low spend, high efficiency, hard to scale further | |
| TV test | 6% | Too early in the curve to judge saturation |
| Base sales (no marketing) | 45% | Not channel-driven; brand, repeat purchase, word of mouth |
The useful decision this enables isn’t “email is small, cut it.” Email’s contribution is modest in absolute terms but comes at very low spend, so its efficiency is actually high. The real signal here is that paid search is close to its ceiling (more spend there won’t produce proportional returns) while paid social has room to absorb additional budget before hitting the same wall. That’s the kind of reallocation call MMM is built to support, and it’s a different conclusion than attribution alone would likely produce, since attribution would probably overcredit whichever channel sits closest to the final click.
Common MMM misconceptions
- “MMM proves causation.” It estimates correlation from aggregated data, controlling for known variables. It’s a strong input to a decision, not proof in the way a true randomized experiment is. Pairing it with occasional incrementality tests is how serious measurement teams close that gap.
- “Free software means a free project.” Robyn and Meridian cost nothing to download. The data cleaning, the time to validate a model against reality, and the ongoing refresh as new data comes in are the actual cost, and that cost doesn’t disappear because the package is open source.
- “More channels in the model is always better.” Adding a channel with too little spend or too little variation just adds noise. A model with fewer, well-measured channels usually outperforms one that tries to account for every minor line item in the media plan.
- “MMM output is a fixed answer.” It’s a model fit to a specific historical window. Market conditions, competitor behavior and your own pricing all shift the real relationship over time, which is why MMM studies get refreshed, not run once and filed away.
The bottom line
Marketing mix modeling isn’t a replacement for attribution or incrementality testing, it’s the piece that works when those two struggle: no user-level tracking required, a strategic view across the whole channel mix, and a defensible basis for next quarter’s budget split. It needs real historical data and real statistical effort to do well, which is why Meta’s Robyn and Google’s Meridian being free doesn’t mean MMM itself is free. For most brands, the right move is attribution for daily tactics, the occasional incrementality test to sanity-check the biggest assumptions, and MMM once there’s enough scale and history to make the modeling worth the setup cost.
Related guides
- Marketing Attribution Models: A Practical Guide for 2026
- Marketing Budget Allocation: A Practical Framework for 2026
- Marketing KPIs That Actually Matter, By Funnel Stage