Playbooks
Marketing Attribution Models: A Practical Guide for 2026
Attribution decides which marketing gets the credit for a sale. Here is how the six models differ, why Google killed most of them inside Google Analytics, and how a small team should actually measure this.


Marketing attribution is the practice of assigning credit for a sale or signup to the marketing touchpoints that led to it. Get it wrong and you pull budget from a channel that was quietly doing the real work, because a different channel grabbed the easy, last-click credit. Get it right and you can answer the question every marketing lead eventually has to answer: where does the next dollar go.
There is no single correct attribution model. There are six common ones, four measurement approaches that sit above them, and a decision about how much rigor your budget actually justifies. This is a guide to all three.
Key takeaways
- Six attribution models are in common use. Google removed four of them from Google Analytics 4 in November 2023, leaving last-click and data-driven as the built-in options.
- Platform attribution (Meta Ads Manager, Google Ads) almost always overstates its own impact, because each platform only sees its own touchpoints and its own attribution window.
- Marketing mix modeling and incrementality testing answer a harder, more honest question than attribution does: what happens to revenue if I stop spending here.
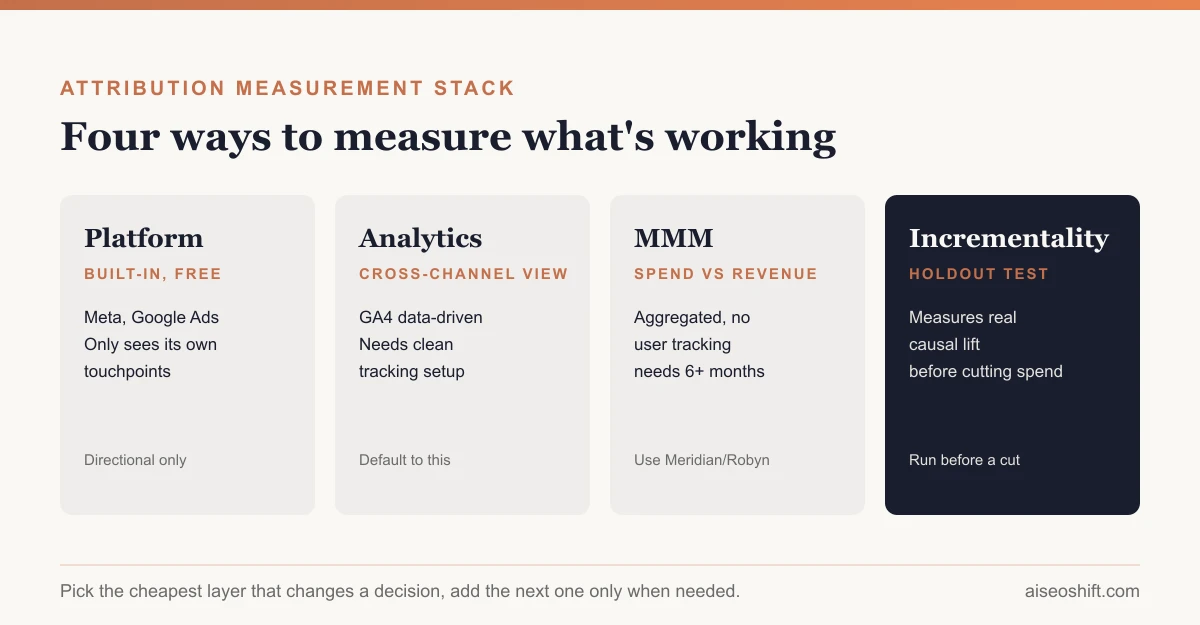
- Most small teams do not need all four measurement layers running at once. Pick the cheapest one that actually changes a budget decision, and add the next layer only when that one stops being believable.
What attribution is actually trying to answer
A customer sees a TikTok ad on Monday, reads a comparison blog post on Wednesday, gets a retargeting ad on Friday, and buys through a Google search on Saturday. Four touchpoints, one sale. Attribution is the set of rules you use to decide how much credit each of those four gets.
That sounds like a reporting detail. It is not. The model you pick changes which channels look like they’re working, which changes where you spend next month, which changes what actually happens to revenue. A business that attributes everything to last-click will systematically overfund search and underfund the earlier-funnel channels that created the demand search is capturing.
The six attribution models
Here is what each model actually does with that four-touchpoint example above, assuming a $100 sale.
| Model | How it splits credit | $100 sale example | Best fit |
|---|---|---|---|
| Last-click | 100% to the final touchpoint before conversion | $100 to Google search | Short sales cycles, direct response |
| First-click | 100% to the first touchpoint | $100 to TikTok | Measuring what starts the journey |
| Linear | Equal credit across every touchpoint | $25 each to TikTok, blog, retargeting, search | Long consideration cycles with many channels |
| Time-decay | More credit to touchpoints closer to conversion | Search gets the most, TikTok the least | Short-to-medium cycles where recency matters |
| Position-based (U-shaped) | 40% first, 40% last, 20% split among the middle | $40 TikTok, $40 search, $10 blog, $10 retargeting | Journeys where the first touch and the close both matter |
| Data-driven | Statistical model (commonly Shapley value or Markov chains) assigns credit based on each touchpoint’s actual contribution to conversion probability, using your account’s own historical data | Varies, recalculated per account | Accounts with enough conversion volume to train the model |
The first five are “rule-based”: you pick a fixed formula and it applies the same way every time, regardless of what the data says actually happened. Data-driven attribution is different. It looks at converting and non-converting paths across your account and calculates, statistically, how much each touchpoint actually raised the odds of conversion. It needs volume to work. Google’s own guidance is that data-driven attribution needs enough conversions and clicks to find a reliable pattern, and it gets less reliable for low-volume accounts.
Rule-based models haven’t disappeared everywhere. Plenty of CRMs, email platforms, and third-party attribution tools still let you pick first-click, linear, or U-shaped as a reporting lens, even though Google dropped four of them from its own product. If a vendor’s dashboard shows you a “position-based” view next to your GA4 numbers, that’s not a tracking conflict. It’s two different tools answering the question with two different formulas, on the same underlying events.
GA4’s 2023 attribution model purge
Here is the part that catches people off guard if they haven’t checked their GA4 settings recently. According to Google’s own Analytics Help documentation, first-click, linear, time-decay, and position-based attribution models stopped being available in Google Analytics 4 as of November 2023. If you built attribution reports in Universal Analytics around any of those four, that comparison doesn’t exist anymore.
What’s left in GA4 is a choice between two models: data-driven attribution, which is the default, and last-click. That’s it. Google’s reasoning, consistent with its direction since introducing GA4, is that data-driven attribution is more accurate than fixed rules, so it stopped offering the alternative rule-based options as a hedge.
The practical effect: if your GA4 reports show more credit flowing to earlier-funnel channels than your old Universal Analytics reports did, data-driven attribution is probably the reason, not a tracking problem. It’s also why two businesses in the same category can see wildly different attribution splits even with similar customer journeys. The model is trained on each account’s own data, so it’s never identical twice.
Google Ads runs a parallel version of this. Data-driven attribution is the default model there too for most conversion actions, per Google’s Ads Help documentation, with last-click kept as the comparison option. Google notes that when conversion data is thin, last-click and data-driven attribution can land on similar numbers anyway, simply because there isn’t enough signal yet for the model to find a different pattern.
Platform vs. analytics vs. MMM vs. incrementality
Attribution models are one layer. The bigger decision is which measurement system you build them on top of, because each one answers a different question and has a different blind spot.
| Approach | What it measures | Blind spot | Rough cost/effort |
|---|---|---|---|
| Platform attribution (Meta Ads Manager, Google Ads, TikTok Ads) | Conversions the platform’s own pixel or API saw, inside its own attribution window | Only sees its own touchpoints; double-counts with other platforms; blind to offline and word-of-mouth | Free, built in |
| Analytics attribution (GA4, a CDP) | Cross-channel journeys stitched together from your own site/app tracking | Misses walled-garden impressions (most in-app views), breaks with ad blockers and privacy settings, still a correlation, not causation | Free to low-cost, needs setup |
| Marketing mix modeling (MMM) | Statistical relationship between spend by channel and revenue over weeks or months, using aggregated data, no individual tracking required | Needs months of consistent spend history to be stable; slow to reflect a change you made last week | Free open-source tools exist (Google’s Meridian, Meta’s Robyn); mid-to-high effort to run well |
| Incrementality testing | Actual causal lift: a holdout group sees no ads (or a geo gets no spend), compared against a group that does | Needs enough volume and patience to get a clean read; not practical for every channel at once | Free to run if your platform supports holdout tests; costs you short-term reach in the test group |
Platform numbers and analytics numbers both describe correlation: this touchpoint was present before this conversion. MMM and incrementality testing are the two approaches built to get at causation: what would have happened anyway. That’s also why they’re more work. A small ecommerce brand can read a Meta Ads Manager dashboard in five minutes. Nobody runs a clean incrementality test in five minutes.
A practical setup for a small team
Most businesses don’t need all four layers running simultaneously, and trying to stand up MMM before you have basic tracking working is a waste of a quarter. A reasonable build order:
- Fix the tracking first. Server-side events, a consistent UTM convention, and conversion events that fire once per actual sale, not once per page load. None of the models above matter if the input data is broken.
- Use GA4’s data-driven attribution as your default view, and keep a tab open on last-click as a sanity check. If the two disagree wildly on a channel, that’s worth investigating before you trust either one fully.
- Treat platform-reported ROAS as directional, not final, especially once you run more than one ad platform. Reconcile platform conversions against your own order data monthly. If Meta and Google Ads together claim more conversions than your store actually recorded, you’ve found the double-counting. This is also where tracking your real customer acquisition cost by channel, not just platform-reported ROAS, keeps you honest.
- Run one incrementality test before you cut a channel’s budget, not after. A two-week holdout on your biggest-spend channel is cheap insurance against pulling money from something that was actually working.
- Only pick up MMM once you have 6+ months of consistent, varied spend data and a question platform attribution genuinely cannot answer, like how your TV or podcast spend affects search demand.
Say you run a $40/month skincare subscription brand spending $8,000/month split across Meta, Google Search, and an affiliate program. A practical setup is: GA4 data-driven attribution for the day-to-day view, a monthly reconciliation against Shopify order data to catch platform over-counting, and a single incrementality test on Meta every quarter to check whether that spend is still earning its keep. That’s enough rigor for a business at that size. MMM would be overkill until spend and channel count roughly triple.
Common attribution mistakes
Comparing ROAS across platforms without checking the attribution window. Meta commonly defaults to a 7-day click/1-day view window; Google Ads windows vary by conversion action and can run much longer. A “3.5x ROAS” on one platform and a “3.5x ROAS” on another are not the same claim if the windows differ.
Trusting a dashboard number that implies more conversions than orders placed. This is the single fastest way to catch double-counting. If your ad platforms report 400 combined conversions in a month and your store processed 310 orders, the gap is inflated credit, not 90 mystery sales.
Switching attribution models mid-campaign and reading the change as performance. Moving from last-click to data-driven, or changing a lookback window, will shift which channels look good. That’s a measurement change, not a channel suddenly improving or declining.
Assuming more touchpoints always means more credit everywhere. Linear and position-based models spread credit by formula, not by actual influence. A channel that appeared in ten light touchpoints is not automatically more valuable than one that appeared in two decisive ones; that’s exactly the gap data-driven attribution and incrementality testing are built to close.
The bottom line
Attribution models answer “who gets the credit.” Measurement approaches answer “can I trust the credit I’m looking at.” Most teams get the second question backwards, arguing over whether to use linear or position-based models in GA4 when GA4 no longer offers either, instead of asking whether their platform dashboards are even measuring something real.
Start by fixing your tracking and reconciling platform numbers against actual orders. That alone catches most of the double-counting. Add an incrementality test before cutting a channel, not instead of one. Save marketing mix modeling for when you have the spend history and the question to justify it. If you’re still deciding what to measure in the first place, our guide to marketing KPIs and what counts as a good ROAS is a useful starting point before you touch attribution settings at all.
Related guides
- How to Build a Full-Funnel Performance Marketing System (Step-by-Step, 2026)
- Marketing Budget Allocation: A Practical Framework for 2026
- LTV:CAC Ratio: Formula, Benchmark and Worked Examples
- Server-Side Tracking Explained: Setup, Cost and When You Need It