Playbooks
Incrementality Testing: How to Know Your Ads Actually Work
Attribution tells you what your pixel saw. Incrementality testing tells you what would have happened anyway. Most accounts need the second number more.


Incrementality testing measures how many of your conversions actually happened because of an ad, not just how many a tracking pixel saw and claimed. You run it by exposing one group to the ad and holding a matched group back, then comparing what each group did. The difference is the lift: the share of results that wouldn’t exist without the spend. Attribution tells you what your tools logged. Incrementality testing tells you what would have happened anyway, which is the number that should actually decide your budget.
Key takeaways
- Incrementality testing isolates causation (did the ad cause the sale) from correlation (did the pixel see the sale), which is what attribution models can’t do.
- The three practical designs are user-level holdout tests, geography-based (geo-lift) tests, and platform-run conversion lift studies from Meta or Google.
- Meta Conversion Lift and Google Conversion Lift both compare an exposed group to a control group, but Meta runs user-level and Google runs mostly geo-level for this specific product.
- Most small accounts don’t have enough weekly conversion volume to get a confident read in a reasonable test window; below roughly $10,000 to $15,000 in monthly spend, a pause test is often more practical than a formal lift study.
- A lift study answers “is this channel working at all,” not “which ad is better.” Keep A/B creative testing for the second question.
What incrementality testing actually measures
Last-click and multi-touch attribution answer a narrower question than most marketers think: “which touchpoint got credit for this conversion, according to the rules this platform or tool uses.” They don’t answer “would this person have converted anyway.” Someone who already decided to buy your product, searched your brand name, and clicked a retargeting ad on the way wasn’t created by that ad. The pixel still logs the conversion. The ad gets credit it didn’t earn.
Incrementality testing closes that gap with a control group. You don’t ask the pixel. You run an experiment: expose one group, hold another group back, and measure the actual difference in outcomes between them. That difference, expressed as a percentage, is your lift. If a campaign shows 1,000 attributed conversions but a 20% lift test says only 250 of those were incremental, the other 750 would have converted with or without the spend. Your real cost per incremental result is four times what the ad platform’s dashboard shows.
This isn’t a new idea. Randomized controlled trials are the same logic clinical research has used for decades. Marketing adopted the formal version of it once platforms built the tooling to randomize ad exposure at scale.
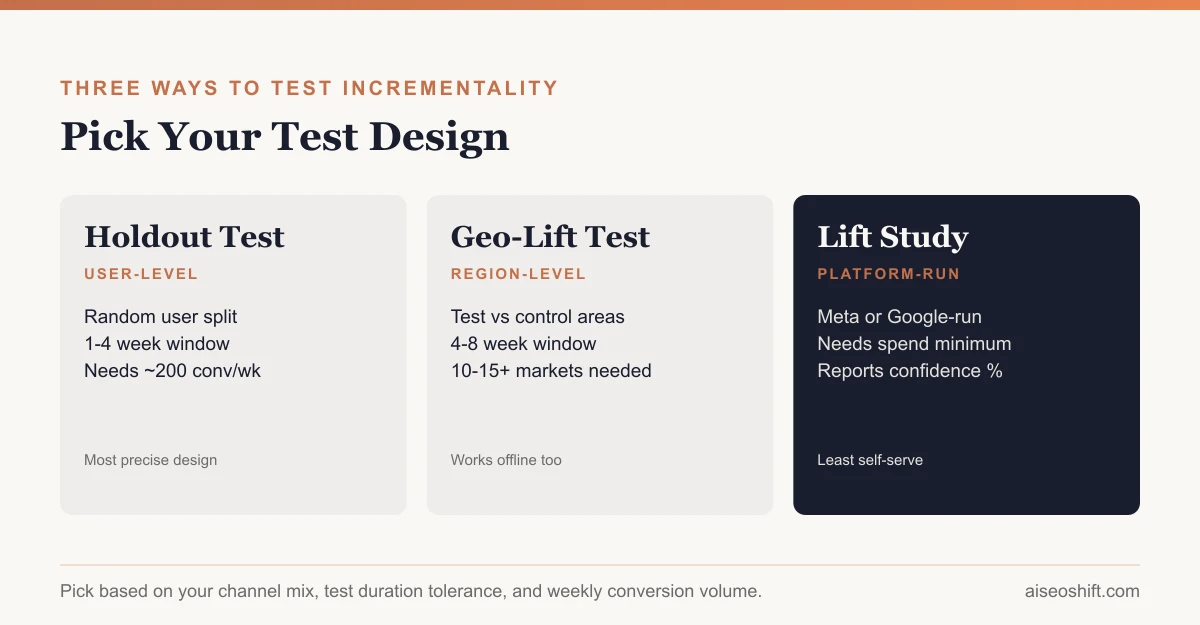
The three practical test designs
Holdout tests (user-level)
A holdout test randomizes individuals or households into an exposed group and a control group that sees zero ads from the campaign, then compares conversion rates between the two. This is what Meta’s own Conversion Lift product and similar features inside ad platforms run. It’s the most precise design because you’re comparing like-for-like people, not aggregated regions, but it only works inside platforms that can control exposure at the user level, which generally means Meta, Google, and a handful of other walled gardens.
Reporting from agencies that run these studies at scale puts a practical floor on when a holdout test produces a usable read: enough weekly conversions in the control cell, usually cited around 200 per week at minimum, to detect a 10 to 20% lift at 80% statistical power and 95% confidence (Cometly’s incrementality testing guide). Below that volume, the confidence interval on your lift estimate gets wide enough to be meaningless.
Geo-lift tests (region-level)
A geo-lift test skips individual randomization and instead turns spend up or down in matched geographic markets, comparing the sales trend in “on” regions against “off” (or lower-spend) regions. You need enough comparable markets, typically cited as a minimum of 10 to 15 matched geographies for a usable design, with a correlation of 95% or higher between test and control markets’ historical sales before the test starts (attn’s geo-lift testing guide). A geo-lift test also runs longer than a user-level holdout, usually four to eight weeks, because regional data is noisier week to week.
The upside: geo-lift works for channels that can’t be targeted at the individual level, like TV, out-of-home, or podcast ads, and it naturally captures conversions a pixel would never see, like in-store purchases.
Platform conversion lift studies
This is the packaged version of the first two ideas, run by the ad platform itself using its own exposure logs and, in some cases, its own aggregated conversion data. Meta Conversion Lift and Google’s Conversion Lift (available both at the user level and, more commonly now, based on geography) are the two most used versions, and they’re where most marketers actually start.
Meta Conversion Lift vs. Google Conversion Lift
| Meta Conversion Lift | Google Conversion Lift | |
|---|---|---|
| Test design | Randomized test and control audiences inside Meta’s ad delivery system | Mostly geography-based (test/control regions); a legacy user-based version also exists |
| Access | Gated; advertisers generally need to go through a Meta account representative | ”Not available for all accounts… contact your Google account representative” per Google’s own help docs |
| Campaign eligibility (geo version) | N/A | Single-country campaigns of type App, Demand Gen, Discovery, Display, Video, Search, Shopping, or Performance Max |
| Core metric | Conversion Lift Percent: incremental conversions divided by estimated conversions without ads | Incremental conversions, incremental cost per action (iCPA), incremental ROAS (iROAS), with a confidence interval |
| Confidence threshold Meta/Google use in reporting | 90%+ confidence considered statistically reliable | A stated confidence interval around the iROAS estimate, e.g. “2.2, with a range of 1.3 to 3.5” |
| Typical practical spend floor | Reporting from measurement vendors puts this around $5,000 in trailing 12-month spend and roughly 500 optimized conversions | No published minimum spend in Google’s documentation; feasibility is scored High, Medium or Low before you commit |
Sources: Meta Business Help Center, Conversion Lift Percent; Meta for Developers, Conversion Lift Measurement; Google Ads Help, About Conversion Lift; Google Ads Help, Set up Conversion Lift based on geography; Google Ads Help, Understand your Conversion Lift based on geography data.
Both products exist for the same reason: platforms know advertisers increasingly distrust attribution that the platform itself grades. A lift study, done properly, is the platform grading its own homework with an actual control group instead of a cookie.
How to design a simple test
You don’t need a $5,000 budget or a data science team to get directional signal. Here’s a version almost any advertiser can run.
- Pick one channel or campaign, not the whole account. Testing “Meta” as a single lever gives you an answer you can act on. Testing everything at once gives you a number with no decision attached to it.
- Decide your control mechanism. If you have 10+ comparable regions or store locations, go geo. If you’re running almost entirely digital and have a platform-native holdout option, use that instead.
- Set your holdout size. Most practical guides land on a 10% holdout for a self-run test when working with individual users, and a larger 20 to 30% holdout by revenue share when working with geo regions, since geo signal is noisier (ATTN, geo-lift testing guide).
- Pick a test window that matches the design. One to four weeks for a user-level holdout with high weekly conversion volume. Four to eight weeks for geo, to average out normal week-to-week noise.
- Freeze everything else. Don’t launch a new promotion, change your homepage, or shift budget on other channels mid-test. Any outside change contaminates the read.
- Compare total conversions, not attributed conversions. The whole point of the test is to stop trusting the attributed number. Pull total revenue or total leads for the exposed group and the control group from your own data, not the ad platform’s dashboard.
A worked example
Say you run a $40 skincare brand doing about $18,000 a month on Meta prospecting. You suspect a chunk of your “attributed” sales are people who’d have bought anyway through organic search or direct visits. You hold back 20% of your prospecting audience from Meta ads for three weeks, using Meta’s own holdout test feature so the split is randomized and recorded. At the end of the window, the exposed group converted at 2.1% and the holdout group converted at 1.7%. The lift is (2.1 - 1.7) / 2.1, or about 19%. Meta’s dashboard, over that period, attributed 310 purchases to the campaign. At a 19% lift, your incrementally caused purchases are closer to 59, not 310. Your real cost per incremental sale is roughly five times the blended CPA you were reporting to your boss.
That’s a hypothetical, built to show the math, not a real case study. Your own numbers could land anywhere, which is the entire reason to run the test rather than guess.
Reading your results
Three numbers matter more than the headline lift percentage:
- Confidence interval. A lift estimate without a range around it isn’t a result, it’s a guess with decimals. Google’s own geo tooling reports results like “iROAS of 2.2, with a confidence interval from 1.3 to 3.5” rather than a single number, because the single number alone overstates certainty.
- Statistical confidence. Most platforms treat 90% or higher as reliable enough to act on. Below that, treat the result as directional only.
- Incremental cost per action (iCPA) or incremental ROAS (iROAS). This is your real efficiency metric; it divides spend by the conversions the test says the ads actually caused, not the ones the pixel claimed.
If your lift comes back near zero or negative, that’s not automatically a reason to kill the channel. It can mean the channel is serving people who were already going to convert (a retargeting or branded search problem), which is fixable by adjusting who you target rather than whether you spend at all.
When it’s worth it, and when it isn’t
Run a lift test when: you’re spending enough on one channel that a wrong efficiency read costs you real budget, you suspect retargeting or branded search is inflating attributed results, or you’re deciding whether to keep funding a channel that looks fine on paper but feels off in gut-check conversations with your own sales or finance team.
Skip it, for now, when: your weekly conversion volume can’t clear the floor needed for statistical power in a reasonable window, you’re optimizing which ad creative wins rather than deciding whether a channel works at all (that’s a separate, narrower question), or you’re pre-product-market-fit and every dollar needs to go toward learning what sells, not proving what already does.
The bottom line
Incrementality testing is the only honest way to find out whether a channel is creating demand or just collecting credit for demand that already existed. It costs you a deliberately wasted holdout group and a few weeks of patience. In exchange, you get a real number instead of an attributed one. Most accounts don’t need to run this constantly. They need to run it once, on the channel they trust the least, before the next budget conversation.
If you’re building out a broader measurement stack rather than a single test, our guide to marketing mix modeling covers the aggregate version of this same question, and marketing KPIs covers which numbers to track day to day between tests. For the account-level changes that affect how Meta serves and measures your ads in the first place, see our breakdown of recent Facebook ads strategy changes. And if ROAS is the number your test is ultimately meant to sanity-check, start with what counts as a good ROAS before you set your target lift.
Related guides
- Marketing Attribution Models: A Practical Guide for 2026
- LTV:CAC Ratio: Formula, Benchmark and Worked Examples
- How to Build a Full-Funnel Performance Marketing System (Step-by-Step, 2026)
- Customer Acquisition Cost: Formula, Examples and How to Lower It
References
- Meta Business Help Center, Conversion Lift Percent
- Meta for Developers, Conversion Lift Measurement, Marketing API
- Google Ads Help, About Conversion Lift
- Google Ads Help, Set up Conversion Lift based on geography
- Google Ads Help, Understand your Conversion Lift based on geography measurement data
- Cometly, incrementality testing for marketing
- ATTN, Geo-Lift Testing Guide: Geographic Marketing Experiments for Accurate Measurement