Playbooks
LTV:CAC Ratio: Formula, Benchmark and Worked Examples
A 3:1 ratio means nothing if you can't say which LTV and which CAC went into it. Here's how to calculate a version of this number that actually holds up.


The LTV:CAC ratio divides a customer’s lifetime value by what it cost to acquire them. A customer worth $300 over their lifetime, acquired for $100, gives a 3:1 ratio, the benchmark most commonly cited across SaaS and ecommerce finance resources as the line between a healthy and a strained acquisition engine.
The division is one step. Getting an honest number into each side of it is the actual work, and it’s where most LTV:CAC ratios quoted in board decks quietly go wrong.
Key takeaways
- The formula is LTV divided by CAC. A commonly cited benchmark across SaaS finance resources is 3:1 or higher.
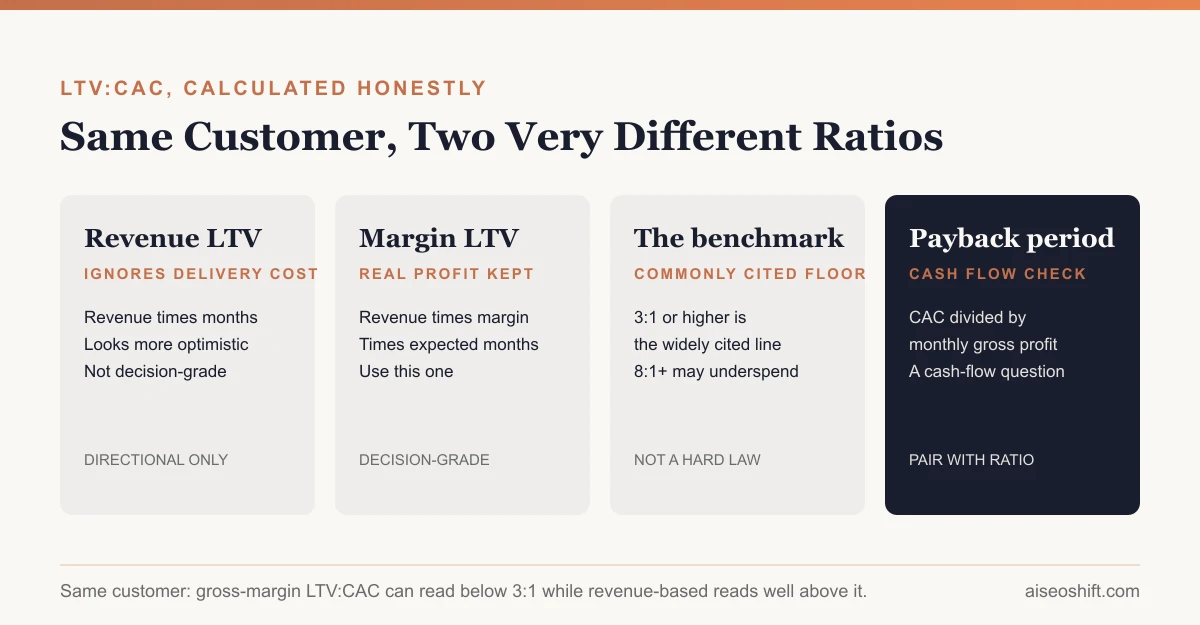
- Revenue-based LTV and gross-margin LTV produce different ratios from the same customer base; gross-margin LTV is the more honest number for a real decision.
- Below 3:1 often signals overspending on acquisition relative to customer value; well above it, 8:1 or higher, can signal underinvestment in growth.
- CAC payback period, how many months to recover acquisition cost, answers a cash-flow question the ratio alone doesn’t.
- Blended CAC against a generous LTV inflates the ratio past what paid acquisition is actually earning back.
The formula, and the two LTVs hiding inside it
LTV:CAC ratio = Customer Lifetime Value ÷ Customer Acquisition Cost
CAC itself has variants worth getting right before this ratio means anything; we cover blended, paid, and fully loaded CAC in detail in our customer acquisition cost guide. LTV has the same problem, with two common versions that produce meaningfully different ratios from identical customer data:
Revenue-based LTV multiplies a customer’s average revenue per period by how long they’re expected to stay. It’s the simpler calculation and the more optimistic number, because it ignores what the business spends to actually deliver the product or service behind that revenue.
Gross-margin LTV applies gross margin to that same revenue figure before multiplying by lifespan, so what’s left reflects profit the business actually keeps per customer, not revenue it has to spend a chunk of just to fulfill. This is the version that should drive a real LTV:CAC decision, because comparing it against CAC, which is itself a real cost, keeps both sides of the ratio measured in the same terms: money that actually left or stayed in the business.
| LTV version | Formula | What it ignores | Use it for |
|---|---|---|---|
| Revenue-based LTV | Avg. revenue per period x expected customer lifespan | Cost to deliver the product/service | Quick, directional estimates |
| Gross-margin LTV | (Avg. revenue per period x gross margin %) x expected customer lifespan | Nothing material; closest to real profit per customer | Real LTV:CAC decisions, budget calls |
A commonly cited benchmark across SaaS resources puts the target ratio at 3:1 or higher, treating that as the floor where acquisition spend is clearly paying for itself with room for the business to still be profitable after fulfillment and overhead. Below that line, a business is typically spending too much relative to what customers are actually worth. Well above it, commonly cited around 8:1 or higher, the read flips: that level can signal a business leaving profitable growth on the table by underspending on acquisition relative to what each customer could justify.
Worked example: ecommerce
Say a $55 skincare subscription box acquires customers through paid social, with a fully loaded paid CAC of $48 (ad spend plus the marketer’s prorated salary and ad tech subscriptions, divided by paid-attributable customers, the way our CAC guide works through it). The average subscriber stays 5 months and the box carries a 45% gross margin after product cost, shipping, and payment processing.
- Revenue-based LTV: $55 x 5 months = $275
- Gross-margin LTV: ($55 x 0.45) x 5 months = $123.75
- Revenue-based ratio: $275 ÷ $48 = 5.7:1
- Gross-margin ratio: $123.75 ÷ $48 = 2.6:1
Same business, same CAC, same customer behavior. One version of the ratio says “comfortably above benchmark.” The other says “slightly below the commonly cited 3:1 line.” The gross-margin number is the one that should actually inform whether to keep scaling this channel at the same CAC, because it’s the number that reflects what the business keeps, not what the customer paid in.
Worked example: SaaS
Say a project management tool charges $40 a month, retains the average customer for 20 months, carries an 80% gross margin (typical for software, where delivery cost per customer is low relative to revenue), and has a fully loaded CAC of $350 per customer through a mix of paid search and content.
- Revenue-based LTV: $40 x 20 months = $800
- Gross-margin LTV: ($40 x 0.80) x 20 months = $640
- Revenue-based ratio: $800 ÷ $350 = 2.3:1
- Gross-margin ratio: $640 ÷ $350 = 1.8:1
Here, both versions sit below the commonly cited 3:1 benchmark, which is the more useful signal: this isn’t a case where the choice of LTV formula flips the verdict, it’s a case where CAC genuinely needs to come down, retention needs to extend, or pricing needs review, regardless of which LTV method gets used to check it.
| Metric | Ecommerce example | SaaS example |
|---|---|---|
| Price point | $55/month | $40/month |
| Avg. customer lifespan | 5 months | 20 months |
| Gross margin | 45% | 80% |
| Fully loaded CAC | $48 | $350 |
| Gross-margin LTV | $123.75 | $640 |
| Gross-margin LTV:CAC | 2.6:1 | 1.8:1 |
CAC payback period: the question the ratio doesn’t answer
LTV:CAC asks whether a customer is worth acquiring, eventually. CAC payback period asks a different, more immediate question: how many months until this customer has paid back what they cost.
CAC payback period = CAC ÷ (Average monthly revenue per customer x gross margin %)
Using the SaaS example above: monthly gross profit per customer is $40 x 0.80 = $32. Payback period is $350 ÷ $32 = 10.9 months, call it 11 months.
A business with plenty of runway can tolerate an 11-month payback if the ratio eventually clears 3:1 over the customer’s full lifespan. A cash-constrained business, reinvesting most of what it earns straight back into acquisition, might not survive waiting 11 months to see that cash again, even with a ratio that looks fine on a spreadsheet three years out. Pair the ratio with payback before deciding a channel is healthy; a good ratio and a bad payback period can both be true about the same customer at once.
Calculate your own, step by step
A template to fill in before you quote a ratio to anyone outside your own spreadsheet:
- Pick a time window and stick to it. A trailing 90 days or a full fiscal quarter both work; mixing windows between the LTV and CAC side of the calculation is the single most common source of a meaningless number.
- Calculate average revenue per customer per period from actual billing or order data, not an assumed average order value.
- Apply your real gross margin percentage, specific to the product line you’re measuring, not a company-wide blended margin that may not reflect that line’s actual delivery cost.
- Estimate lifespan from cohort data, ideally the actual average retention of customers acquired 6 to 12 months ago, not a guess based on how long you’d like customers to stay.
- Choose your CAC version to match the question. Use paid CAC against paid-channel LTV if you’re deciding whether to scale a specific channel. Use blended CAC against blended LTV only for overall business health reporting, never for a channel-level call.
- Calculate payback period alongside the ratio, not instead of it. A business deciding whether it can afford a channel needs both numbers, not just the one that looks better.
LTV:CAC by channel, not just blended
Calculating one company-wide ratio hides which channels are actually earning their acquisition spend back and which are being carried by the others. Extending the ecommerce example above across channels:
| Channel | Fully loaded CAC | Gross-margin LTV | Ratio |
|---|---|---|---|
| Paid social | $48 | $123.75 | 2.6:1 |
| Paid search | $62 | $123.75 | 2.0:1 |
| Email (existing list, low cost) | $18 | $123.75 | 6.9:1 |
| Affiliate/referral | $35 | $123.75 | 3.5:1 |
A single blended ratio across all four channels would land somewhere in the middle and hide that paid search specifically needs attention, while email and referral are quietly outperforming the benchmark by a wide margin. Calculate this per channel before deciding where to move budget, the same way our customer acquisition cost guide breaks CAC down by channel rather than relying on one blended figure.
Pitfalls that distort the ratio
- Blending CAC while using a generous LTV. Blended CAC folds in free organic and referral customers, making paid acquisition look cheaper than it is. Pair blended CAC with blended LTV, or paid CAC with paid-channel LTV, not a mismatch of the two.
- Guessing customer lifespan instead of measuring it. An assumed “24 months” lifespan with no cohort data behind it turns the whole ratio into a guess wearing a decimal point.
- Using revenue-based LTV and quoting it as if it were the gross-margin number. The two produce genuinely different ratios from the same data, as both worked examples above show; conflating them misleads whoever’s reading the number.
- Treating the 3:1 benchmark as a hard line regardless of business model. It’s a widely cited starting point, not a law. A capital-efficient business with fast payback can run sustainably below it short-term; a business already burning cash fast cannot.
- Ignoring that LTV changes as a cohort ages. Early LTV estimates on a new product often run optimistic or pessimistic simply because there isn’t enough retention data yet to know the real curve.
The bottom line
LTV:CAC ratio is one division problem wearing two sets of ambiguous inputs. Pick gross-margin LTV over revenue-based LTV for any decision that actually spends money, pick a CAC version (paid or fully loaded, not blended) that matches what you’re trying to learn, and treat the commonly cited 3:1 benchmark as a reasonable floor rather than a verdict. Pair the ratio with CAC payback period before calling a channel healthy or broken, since a ratio that looks fine over a customer’s full lifetime can still represent a cash-flow problem long before that lifetime plays out.
Once the ratio holds up to scrutiny, it’s worth checking against the rest of your marketing KPIs rather than in isolation, and if the number looks weak specifically because of a weak LTV side rather than a high CAC, that usually points back to retention; our guide to customer retention strategies covers the levers that move LTV directly.
Related guides
- How to Build a Full-Funnel Performance Marketing System (Step-by-Step, 2026)
- Incrementality Testing: How to Know Your Ads Actually Work
- Marketing Budget Allocation: A Practical Framework for 2026
- Server-Side Tracking Explained: Setup, Cost and When You Need It