Playbooks
12 Customer Retention Strategies That Actually Move the Number
Retention is not a loyalty program. It is twelve small decisions made correctly, repeated every month, and measured by cohort instead of one blended average.

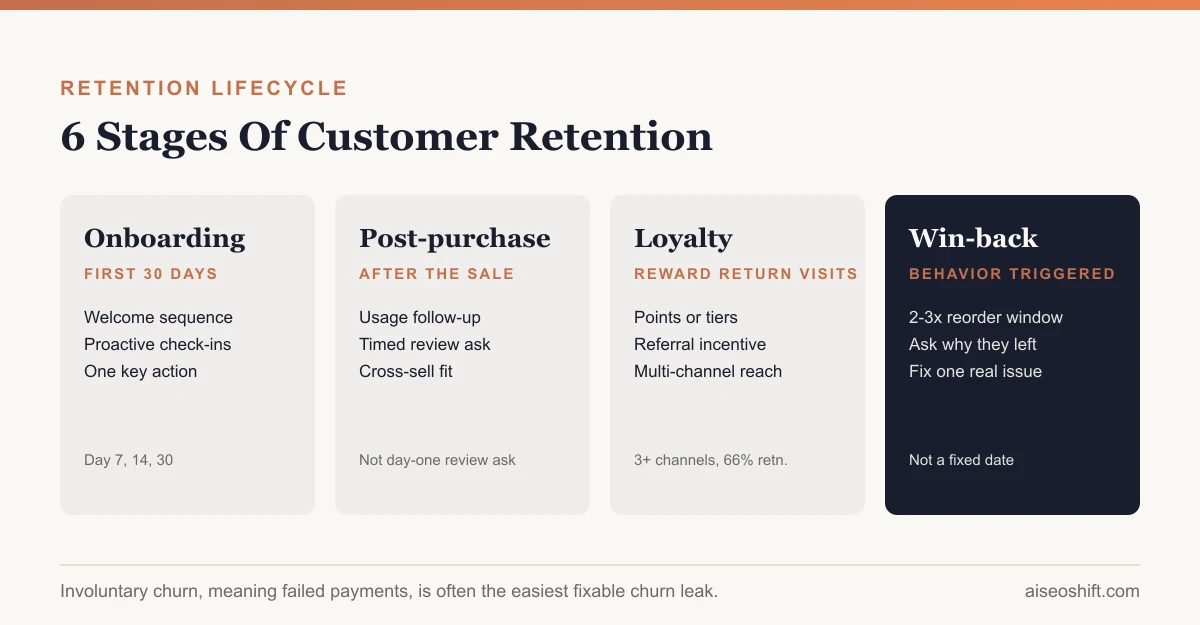
Customer retention strategies work in combination, not isolation. The companies that hold onto customers best run a specific program at each stage: a real onboarding sequence, a reason to buy again, a loyalty mechanic, a dunning process for subscriptions, fast service recovery and a win-back trigger. None of those on their own moves the number much. Together, they do.
This post gives you 14 strategies grouped by stage, the formulas for measuring retention correctly, and what changes between ecommerce and SaaS.
Key takeaways
- Retention strategies only work grouped by lifecycle stage: onboarding, post-purchase, loyalty, subscriptions, service and win-back each need a different tactic.
- Measure retention by cohort, not one blended number. A single company-wide retention rate can hide a cohort that’s quietly getting worse.
- For subscription businesses, Recurly’s July 2026 data puts SaaS churn at 3.22% annual and ecommerce subscriptions at 4.25%, with involuntary churn (failed payments) making up roughly a third of both.
- Involuntary churn, meaning failed card payments, is often the single biggest fixable leak in a subscription business, and it has nothing to do with whether customers like your product.
- Don’t quote the “5x cheaper to retain” stat. We looked for a primary source and couldn’t confirm the number; use your own CAC and repeat-purchase data instead.
How to measure retention correctly
Three formulas cover most of what you need.
Customer retention rate
Retention rate = ((E - N) / S) x 100E = customers at the end of the period. N = new customers acquired during the period. S = customers you started with. Subtracting N matters: without it, new growth can disguise churn in your old customer base.
Churn rate
Churn rate = 1 - retention rateOr directly: customers lost during the period, divided by customers at the start. For subscription businesses, split this into voluntary churn (customers who chose to cancel) and involuntary churn (failed payments, expired cards). They need different fixes.
Cohort retention
Group customers by the month they first bought or signed up. Track what percentage of that exact group is still active at 30, 90, 180 and 365 days. Plot it as a curve, not a single number.
| Metric | What it tells you | Where it’s most useful |
|---|---|---|
| Retention rate | Overall health, period over period | Board reporting |
| Churn rate (voluntary vs. involuntary) | Where you’re bleeding customers and why | Subscription businesses |
| Cohort retention curve | Whether newer customers behave differently than older ones | Diagnosing a recent problem |
| Repeat purchase rate | Share of customers who bought more than once | Ecommerce, one-time purchase models |
A worked example: why the blended number lies to you
Say a subscription box company has 10,000 customers at the start of the year, adds 4,000 new customers over the year, and ends with 11,500 customers.
Retention rate = ((11,500 - 4,000) / 10,000) x 100 = 75%. Churn rate = 25%.
That 75% looks fine against the industry median. But split it by cohort and the picture changes. Customers who joined 18+ months ago are retaining at 85%. Customers who joined in the last two quarters are retaining at 60%. The blended number of 75% is an average of a healthy old base and a newer base that’s leaking, and nothing in the single company-wide figure would have told you that. Only the cohort curve does.
This is why a retention dashboard needs at least two views: one trailing number for the board, and one cohort table, refreshed monthly, for the team that actually has to fix anything.
14 retention strategies, grouped by stage
Onboarding
1. Build a welcome sequence around one first action, not a tour. The goal of onboarding email isn’t to explain every feature. It’s to get the customer to do the one thing that predicts they’ll stick around: log a second order, invite a teammate, complete setup. Our welcome email sequence guide covers the structure.
2. Add a proactive check-in at day 7, 14 and 30 for SaaS. Don’t wait for a support ticket. A short email or in-app message asking “did you get X set up” catches confusion before it becomes a cancellation. Say a project management tool notices a new account hasn’t invited a teammate by day 7. A single email nudging that one action, with a two-click invite link, does more for retention than a feature announcement ever will, because it targets the specific gap instead of broadcasting to everyone the same way.
Post-purchase
3. Follow up on delivery with usage guidance, not a review request. The first email after an order arrives should help the customer get value from what they bought. A skincare brand might send application tips. A software signup might send a 2-minute setup checklist.
4. Time the review request to actual usage, not order date. Asking for a review the day an order ships gets a rating on the unboxing, not the product. Wait until there’s been time to use it.
Loyalty
5. Run a points or tiered program that rewards the second purchase, not just volume. Say a $40 skincare brand gives a small credit on a customer’s second order inside 60 days, separate from its main loyalty tier. That’s a retention mechanic, not a loyalty mechanic, and it’s worth testing before building the full tiered version. See loyalty program ideas for structures that work at different budget levels.
6. Add a referral incentive that rewards both sides. Customers who refer someone and get rewarded for it are more invested in staying. Our referral program ideas post has templates by business type.
7. Layer channels instead of relying on email alone. Per a 2019 Omnisend analysis of its customer base, marketers using three or more channels saw a 66% retention rate against 34.8% for marketers using a single channel. That data is dated, so treat it as a directional argument for diversifying channels, not a number to plan around.
Subscriptions
8. Fix involuntary churn before you touch voluntary churn. Recurly’s July 2026 benchmarks show involuntary churn (failed payments) making up roughly a third to a half of total churn across every industry it tracks. Card retry logic, updated-card prompts and dunning emails recover revenue with zero product or pricing changes.
9. Give subscribers a pause option before they cancel. A customer who pauses for two months is still a customer. A customer who cancels because pausing wasn’t offered is gone, and reacquiring them costs more than the pause would have. Put the pause option on the cancellation page itself, not three menus deep. If a customer has to search for how to pause, they’ll just hit cancel instead.
Service
10. Resolve the first contact instead of escalating by default. A customer who has to repeat their issue to a second agent is measurably more likely to churn. Track first-contact resolution as a retention metric, not just a support metric.
11. Build a simple health score and act on drops. For SaaS, this can be as basic as login frequency plus feature usage. When a healthy account’s score drops two tiers in a month, that’s a retention trigger, not a data point to review next quarter. You don’t need a data science team for version one. A spreadsheet that flags “logins down 50% month over month” and routes that account to a human is a health score. Build the dashboard once the manual version proves the alert is worth acting on.
Win-back
12. Trigger win-back off behavior, not a fixed calendar date. For ecommerce, that means watching when a customer’s typical repurchase window has passed by 2-3x. For SaaS, start the clock at cancellation, not three months later.
13. Ask why they left, and change something because of the answer. A one-question survey at cancellation (“what made you decide to cancel”) that never changes product decisions is just data collection. Close the loop with at least one visible fix a quarter.
Across the lifecycle
14. Put one person’s name on the retention number. Acquisition almost always has an owner. Retention often doesn’t, and metrics without an owner don’t move. Pair this with the customer acquisition cost you’re already tracking so retention and acquisition get judged against the same dashboard.
Ecommerce vs. SaaS: the real differences
| Ecommerce | SaaS | |
|---|---|---|
| Primary churn signal | Time since last order | Drop in login/feature usage |
| Median annual churn (Recurly, July 2026) | 4.25% (subscription ecommerce) | 3.22% |
| Biggest controllable lever | Repeat purchase timing, loyalty | Involuntary churn, onboarding activation |
| Typical retention metric | Repeat purchase rate | Net revenue retention, logo churn |
| Win-back trigger | 2-3x average reorder window | Cancellation date |
Repeat purchase rate for ecommerce is simple: customers with 2 or more orders, divided by total customers, in a given period. It’s the single most useful number for a store that doesn’t run subscriptions, because it tells you whether the business is growing on new customers alone, which is expensive and fragile, or on a mix that includes people coming back.
The category matters more than most people assume. A skincare brand selling a 60-day moisturizer has a natural repurchase window built into the product itself. A furniture store doesn’t, and chasing a high repeat purchase rate there usually means pushing the wrong second product instead of accepting that retention for that category looks more like reviews, referrals and brand recall than repeat transactions in month two.
A 30-day retention audit template
Run this before you add a new tactic. Half the time, the fix is something already broken, not something missing.
| Area | Check | Owner |
|---|---|---|
| Onboarding | Is there a welcome sequence tied to one first action? | |
| Post-purchase | Does the first post-order email help them use the product? | |
| Loyalty | Is there any mechanic rewarding a second purchase inside 60 days? | |
| Subscriptions | Is card-failure recovery automated, or manual? | |
| Service | Is first-contact resolution tracked at all? | |
| Win-back | Is the trigger behavior-based or calendar-based? | |
| Reporting | Is retention tracked by cohort, or one blended number? |
The bottom line
Retention strategies fail when they’re treated as one initiative, usually a loyalty program, bolted on and left alone. They work when each lifecycle stage gets its own small, specific tactic, and when you’re measuring cohorts instead of a single company-wide average that can hide a declining newer group behind a strong older one.
Start with the audit table. Fix what’s broken before you add what’s missing.
Related guides
- Black Friday Marketing Ideas for 2026 (Full Timeline Inside)
- Abandoned Cart Email: A 3-Email Flow You Can Copy Today
- 10 Copyable Cold Email Templates That Actually Work
- Email Deliverability: SPF, DKIM, DMARC and the 2024 Bulk Sender Rules