Playbooks
Customer Acquisition Cost: Formula, Examples and How to Lower It
CAC is one division problem that gets complicated fast depending on what you put in the numerator. Here is how to calculate it so the number means something.


Customer acquisition cost (CAC) is total sales and marketing spend divided by the number of new customers that spend produced, over the same period. A business that spends $36,000 and gets 1,000 new customers has a $36 CAC. The number gets more useful, and more complicated, once you decide what belongs in that numerator.
Most CAC numbers reported in board decks are wrong in one of two directions: too optimistic because they exclude real costs, or too pessimistic because they ignore how customers actually arrive for free.
Key takeaways
- The base formula is simple: total spend divided by new customers. The variants differ only in what counts as spend.
- Blended CAC includes organic and referral customers in the denominator, which makes every paid channel look cheaper than it is.
- Fully loaded CAC adds salaries, tools, and overhead, not just ad spend, which is the number that should drive real budget decisions.
- A widely cited target is an LTV to CAC ratio of at least 3:1.
- CAC payback period, how many months to recover the acquisition cost, often matters more day-to-day than the ratio itself, especially for cash-constrained businesses.
The base formula, and why the variants exist
CAC = Total cost of sales and marketing ÷ Number of new customers acquired
That’s the whole formula. The complexity is entirely in what you put in the numerator and which customers you count in the denominator. Three versions matter in practice:
| Version | Numerator includes | Denominator includes | Use it for |
|---|---|---|---|
| Blended CAC | All sales + marketing spend | All new customers, including organic/referral | Overall business health, board reporting |
| Paid CAC | Only paid channel spend | Only customers attributable to paid channels | Judging whether a specific paid channel is profitable |
| Fully loaded CAC | Ad spend + salaries + tools + agency fees + overhead | New customers from that spend | Real budget and headcount decisions |
Blended CAC is the easiest to calculate and the easiest to misread. If half your new customers come in free through word of mouth, blended CAC quietly splits your real paid acquisition cost across customers who never saw an ad. That makes every channel look more efficient than it is.
Worked example: the same business, three numbers
Say a direct-to-consumer coffee subscription spends $50,000 on paid ads and content in a month, pays two marketers a combined $14,000 for that month, and uses $2,000 of marketing software. That same month, 1,200 new customers sign up: 800 can be traced to paid channels, and 400 came from organic search, referral, and word of mouth.
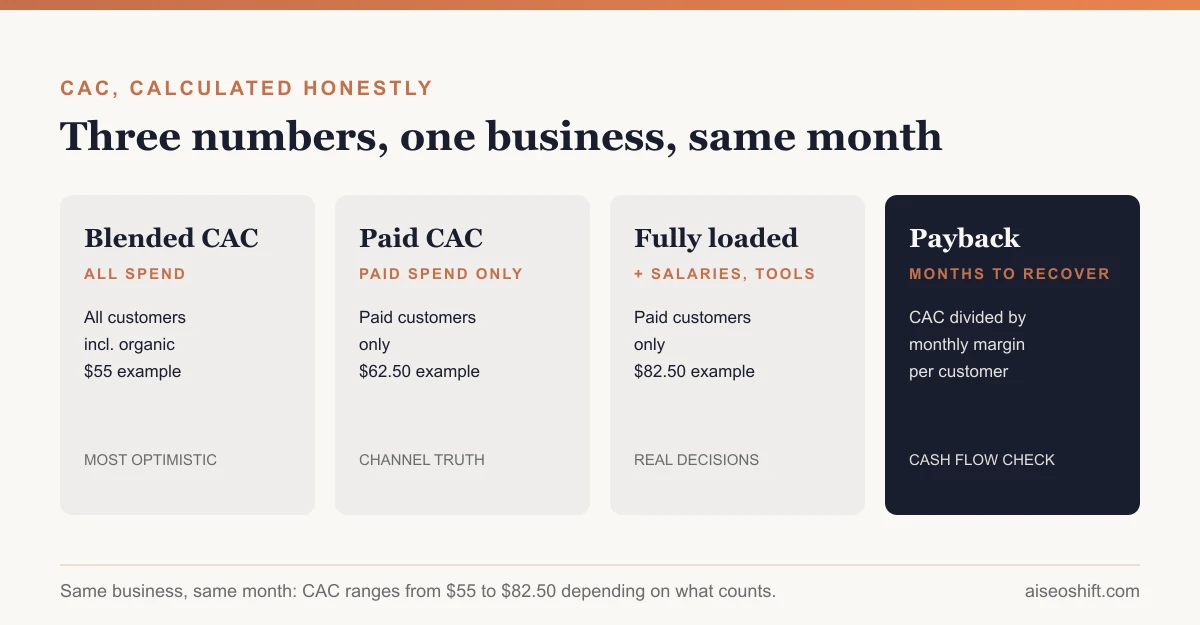
- Blended CAC: ($50,000 + $14,000 + $2,000) ÷ 1,200 = $55
- Paid CAC: $50,000 ÷ 800 = $62.50
- Fully loaded CAC (paid channel): ($50,000 + $14,000 + $2,000) ÷ 800 = $82.50
Same business, same month, three defensible numbers ranging from $55 to $82.50. The $55 figure looks the healthiest and is the one most likely to get quoted externally. The $82.50 figure is the one that should actually inform whether paid acquisition is worth scaling, because it’s the number that reflects what the company actually spent to get those specific customers.
LTV to CAC ratio: the sanity check
Once CAC is calculated honestly, compare it against customer lifetime value (LTV). A commonly cited target is 3:1, lifetime value at least three times acquisition cost.
Below 3:1 usually means the business is spending too much relative to what a customer is worth, and margins get thin fast at scale. Well above 3:1, say 8:1 or higher, often means the opposite problem: the business is leaving profitable growth on the table by underspending on acquisition relative to what each customer is actually worth.
Using the coffee subscription example: if the average customer generates $240 in gross margin over their lifetime, the fully loaded paid CAC of $82.50 gives a ratio of roughly 2.9:1, just under the commonly cited threshold. That’s the kind of gap a ratio calculation catches that a raw CAC number alone won’t.
CAC payback period: the number that matters for cash flow
CAC payback period answers a different question than the ratio: not “is this customer worth it eventually,” but “how many months until this customer has paid back what they cost.”
CAC payback period = CAC ÷ (Average monthly revenue per customer × gross margin %)
Take a SaaS business with a fully loaded CAC of $600, an average customer paying $50 a month, and a 75% gross margin. Monthly gross profit per customer is $37.50, so payback period is $600 ÷ $37.50 = 16 months.
That’s the number that tells a cash-constrained business whether it can actually afford to keep acquiring at that cost, independent of whether the lifetime value math eventually works out. A business burning cash to acquire customers with a 16-month payback needs either more runway, a cheaper acquisition channel, or a higher starting price, regardless of how good the LTV:CAC ratio looks on a spreadsheet three years out.
CAC by channel
Calculate CAC separately per channel using the paid CAC formula, spend on that channel divided by customers attributable to it, rather than relying on a single blended number to compare channels against each other.
| Channel | Spend | New customers | CAC |
|---|---|---|---|
| Paid social | $20,000 | 320 | $62.50 |
| Paid search | $18,000 | 280 | $64.29 |
| Influencer/affiliate | $8,000 | 150 | $53.33 |
| Email (to existing list) | $4,000 | 50 | $80.00 |
Attribution is the hard part here, not the arithmetic. Last-click attribution tends to overcredit whichever channel closes the sale, usually paid search or email, and undercredit the channel that actually created awareness. If you’re running paid social, Facebook ads not delivering and TikTok ads best practices both cover the setup issues that quietly inflate CAC on those channels before attribution even enters the picture. For a cleaner read on whether a channel’s spend is actually driving the customers credited to it, see incrementality testing, which measures causation rather than correlation.
How to actually lower CAC
In rough order of how durable the fix is:
- Fix conversion rate before cutting spend. The same traffic converting at 3% instead of 2% lowers CAC by a third with zero change to media spend. See what is a good ROAS for the related calculation on the revenue side of this same funnel.
- Increase the organic and referral share of new customers. Every customer who arrives free lowers blended CAC without touching paid CAC at all. A working referral program is the most direct lever here.
- Reallocate, don’t just cut, spend. Move budget from channels above your LTV:CAC threshold toward channels below it, rather than cutting total spend, which usually just lowers customer volume along with CAC.
- Improve retention. Higher retention raises LTV, which loosens the ratio even if CAC itself doesn’t move. It’s a lever on the other side of the same equation, worth remembering when CAC alone feels unfixable in the short term.
- Track CAC against the rest of your marketing KPIs, not in isolation. A channel’s standalone CAC can look fine while the same channel’s incremental contribution, what it adds beyond what would have happened anyway, is close to zero.
Once you’ve nailed down timing on when new customers actually convert, a welcome email sequence tuned to signup source is one of the lower-cost ways to raise the conversion rate that feeds directly into every CAC number above.
Common mistakes that distort the number
- Mixing time periods. Counting spend from a 30-day window against customers acquired over 45 days, because sales cycles lag ad spend, inflates or deflates CAC depending on which direction the mismatch runs. Match the spend window to when the customers it influenced actually convert, not to the calendar month it happened to fall in.
- Forgetting free-trial or freemium costs. If free users cost real money (hosting, support, onboarding) before they convert to paying, a CAC calculated only on paid-conversion spend understates the true cost of the funnel that produced them.
- Counting brand spend as acquisition spend. A brand awareness campaign with no direct response mechanism arguably shouldn’t sit in the same CAC bucket as a direct-response ad, even though both are marketing spend. Many businesses split CAC into “performance CAC” and total marketing spend for exactly this reason.
- Ignoring sales team cost for self-serve products. If support or success reps spend meaningful time nudging free users toward a paid plan, that’s acquisition cost even if no salesperson is formally “in sales.”
What counts as spend, decided up front
Before calculating CAC for the first time at a company, write down what counts, once, and keep it consistent across months so the trend line means something:
| Cost category | Include in fully loaded CAC? |
|---|---|
| Paid ad spend across all channels | Yes |
| Agency or freelancer fees for campaign management | Yes |
| Marketing software and ad tech subscriptions | Yes |
| Marketing team salaries (prorated to acquisition-focused work) | Yes |
| Sales team salaries, for sales-assisted acquisition | Yes, if sales touches new customer acquisition |
| Content and SEO costs with long payback windows | Debatable, track separately if the lag is long |
| Customer success costs post-signup | No, that’s retention cost, not acquisition cost |
| Product development costs | No |
The specific list matters less than keeping it identical month over month. A CAC trend that’s actually comparing different cost baskets across periods isn’t a trend, it’s noise that looks like a trend.
Write the definition down somewhere everyone pulling the number can see it, a shared doc, a dashboard note, anywhere that isn’t just one marketer’s memory. The number is only useful for decisions if finance, marketing, and leadership are all looking at the same calculation when they argue about whether a channel is working.
The bottom line
CAC is one division problem with three honest answers depending on what you count. Blended CAC is the easiest number and the easiest to misread. Fully loaded paid CAC, spend plus salaries and tools, divided by only the customers that spend produced, is the number that should drive real decisions.
Pair it with LTV:CAC (3:1 is the commonly cited floor) for whether a customer is worth acquiring, and CAC payback period for whether you can afford to wait for that value to show up. Lower CAC durably by fixing conversion and retention, not by cutting spend until the volume drops along with it.
Related guides
- LTV:CAC Ratio: Formula, Benchmark and Worked Examples
- How to Build a Full-Funnel Performance Marketing System (Step-by-Step, 2026)
- Marketing Budget Allocation: A Practical Framework for 2026
- Server-Side Tracking Explained: Setup, Cost and When You Need It