Playbooks
Marketing Budget Allocation: A Practical Framework for 2026
Most marketing budgets get built once a year and then defended, not adjusted. Here is a framework for setting the number and moving it as the data comes in.

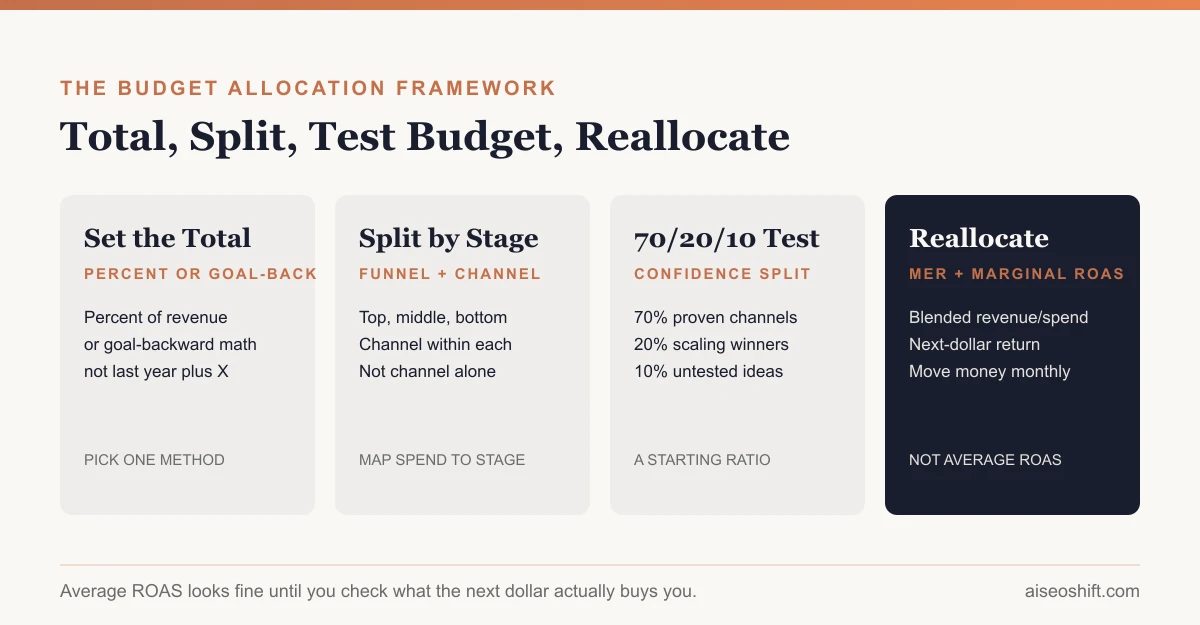
Setting a marketing budget means answering two separate questions: how much total money to spend, and how to split it. Most teams only answer the first question once a year and then stop looking at the second one until something breaks. A better approach sets the total with a defensible method, splits it by funnel stage and channel using a starting heuristic, and then moves money monthly based on marginal return, not the plan you wrote in October.
Key takeaways
- Average marketing spend sits at 9.0% of company revenue as of the Spring 2026 CMO Survey, down to its lowest share in several years.
- 70/20/10 (proven, scaling, untested) is a reasonable starting split, not a formula to defend forever.
- Track MER (total revenue over total marketing spend) alongside channel-level ROAS, since platform-reported numbers overlap.
- Reallocate based on marginal ROAS, the return on the next dollar, not average ROAS, which almost always overstates what more spend will do.
- Review channel splits monthly. Review the total annual number quarterly at most.
How much should the total budget be
There are two honest ways to set a total marketing budget, and a third dishonest one that most companies actually use.
Percent of revenue. The Spring 2026 edition of The CMO Survey, run jointly by Deloitte, Duke University’s Fuqua School of Business and the American Marketing Association, found marketing budgets averaging 9.0% of company revenue and 9.6% of overall company budgets, both the lowest levels the survey had recorded since 2021. The same survey found overall marketing spending grew only 1.7% over the prior 12 months, the weakest growth rate since 2021, while digital marketing spending specifically grew 8.2%. Use a figure like this as a sanity check on where your number falls relative to other companies, not as the number itself. A company selling a $9 subscription and a company selling $40,000 enterprise contracts should not use the same percentage.
Goal-backward. Work from the revenue or pipeline target, the average deal size or order value, and your current conversion rates at each funnel stage, to calculate how many leads or customers you need and what acquiring them should cost. This method produces a number tied to an actual business target instead of an industry average, and it is the more defensible one if finance asks you to justify the figure.
The dishonest third method is taking last year’s number and adding a percentage, which is what actually happens in a lot of companies regardless of what the planning deck says. It is fine as a starting point under time pressure. It is not a method, and it stops being defensible the moment growth targets change and the budget does not.
Worth flagging from the same CMO Survey data: when profits come in below expectations, 53.1% of company executives respond by cutting expenses rather than investing in growth, up from 46.0% a year earlier, and marketing budgets get cut more often than other expense categories when that happens. If your budget is likely to face a mid-year cut, build the plan knowing which channels you would protect first.
Splitting by funnel stage and channel
Once the total is set, split it two ways at once: by funnel stage (top, middle, bottom) and by channel within each stage. A common mistake is splitting by channel only, which hides the fact that most of the budget is quietly going to one stage of the funnel.
| Funnel stage | Typical goal | Common channels |
|---|---|---|
| Top (awareness) | Reach new audiences who do not know the brand | Paid social prospecting, YouTube, influencer/UGC, podcasts |
| Middle (consideration) | Move people from aware to interested | Retargeting, email nurture, content, comparison pages |
| Bottom (conversion) | Close people who are ready to buy | Search (branded and high-intent), checkout retargeting, retention email |
A business with a long sales cycle, enterprise software for example, usually needs more weight in the middle stage, where nurture and content do the work over months. A business with an impulse-buy product usually needs more weight at the top and bottom, with less need for a long middle stage.
The 70/20/10 test budget
A common starting heuristic for splitting spend by confidence level, not funnel stage:
- 70% to proven channels and tactics. Things with a track record in your account, where you already know roughly what a dollar returns.
- 20% to scaling what is working but not yet proven at volume. A channel or creative angle that performed well in a small test and is being given more budget to see if it holds up.
- 10% to genuinely untested ideas. New channels, new formats, new audiences you have no data on yet.
This is a starting point for teams without their own data, not a rule to defend once you have six months of results. If your 10% test budget keeps finding winners, that ratio should shift toward more testing. If it keeps finding nothing, shrink it and put the money back into the 70%.
Reallocating with data instead of opinion
The number that matters most for the reallocation decision is not ROAS by channel. It is MER, marketing efficiency ratio, total revenue divided by total marketing spend across every channel combined. Platform-reported ROAS from Meta, Google and TikTok each tend to take credit for the same conversion when a customer sees ads on more than one platform before buying, so adding up channel ROAS numbers overstates what your total spend actually produced. MER looks at the blended outcome: total revenue over the period, divided by total marketing spend over the same period.
The second number that matters is marginal ROAS, not average ROAS. Average ROAS is the return across all the spend a channel has already received. Marginal ROAS is the return on the next dollar you would add to it, and it is almost always lower than the average, because the cheapest, highest-intent conversions in any channel get captured first and every additional dollar chases a slightly less eager prospect. A channel can show a strong average ROAS and still be a bad place to add more budget if its marginal return has already flattened.
For a deeper framework on separating correlation from actual causal lift when comparing channels, see our guide to marketing mix modeling, and for the specific question of what a healthy return looks like in the first place, see what is a good ROAS. Our measurement system guide covers how to build the reporting layer that makes MER and marginal ROAS visible on an ongoing basis rather than a one-off spreadsheet exercise. And for a sense of what good tracking looks like across your full set of channels, our marketing KPIs breakdown is a useful companion to this piece.
A worked allocation example
Say a direct-to-consumer brand has a $100,000 monthly marketing budget and roughly $1.1 million in monthly revenue, giving it a MER of 11. A hypothetical starting split, before any reallocation:
| Channel | Starting allocation | Reported ROAS | Signal |
|---|---|---|---|
| Paid social prospecting | $35,000 | 2.1x | Average, but marginal ROAS trending down two months running |
| Paid social retargeting | $15,000 | 6.5x | Strong, but small audience, limited room to scale further |
| Search (branded + high-intent) | $20,000 | 9.0x | Strong and has not been given more spend in months |
| Influencer/UGC content testing | $10,000 | Not directly attributable | Feeding the top of funnel, judged on assisted conversions and MER lift |
| Email/retention | $8,000 | 18x | High, low ceiling to scale further since it is capped by existing customer count |
| Untested channel test budget | $12,000 | N/A | Following the 10% test allocation |
Reading this table the way the framework intends: search is underfunded relative to its marginal return and should get more budget before social prospecting does, since prospecting’s marginal ROAS is already sliding. Retargeting and email are both strong but capped by audience size, so throwing more money at them will not move MER much. The next reallocation moves money from the softest end of social prospecting into search, and holds the test budget steady rather than cutting it the moment one channel looks shaky.
The bottom line
A marketing budget is not a number you set once. It is a total, set with a defensible method, split across funnel stages and channels using a starting ratio, then moved every month based on marginal return rather than last quarter’s dashboard. The teams that get reallocation right are not the ones with the biggest budget. They are the ones that actually look at marginal ROAS and MER before deciding where next month’s dollar goes.
Related guides
- Marketing Attribution Models: A Practical Guide for 2026
- LTV:CAC Ratio: Formula, Benchmark and Worked Examples
- Customer Acquisition Cost: Formula, Examples and How to Lower It
- Incrementality Testing: How to Know Your Ads Actually Work