Playbooks
Marketing KPIs That Actually Matter, By Funnel Stage
Most marketing dashboards are full of numbers nobody acts on. Here is the shorter list that actually changes decisions, broken out by funnel stage and business model.


A marketing KPI is a number tied to a decision: if it moves, you do something different. The KPIs that matter change by funnel stage (awareness, consideration, conversion, retention) and by business model (ecommerce lives on ROAS and repeat purchase rate, SaaS lives on CAC payback and net revenue retention). Below is the full list by stage and model, the formula for each, who should see it, and the vanity metrics worth cutting from your next report.
Key takeaways
- Four KPIs show up in almost every business model: CAC, your main-stage conversion rate, marketing-sourced revenue, and retention.
- Ecommerce and SaaS KPI sets diverge hard at the bottom of the funnel: ROAS and AOV versus CAC payback and net revenue retention.
- A KPI has to be tied to a decision. If nothing changes when the number moves, it is a vanity metric, not a KPI.
- Match the report to the reader. A CEO needs three to five numbers. A channel owner needs the diagnostic detail underneath them.
- Impressions, follower count, and raw traffic are the three most commonly mis-reported vanity metrics.
The KPIs that matter at each funnel stage
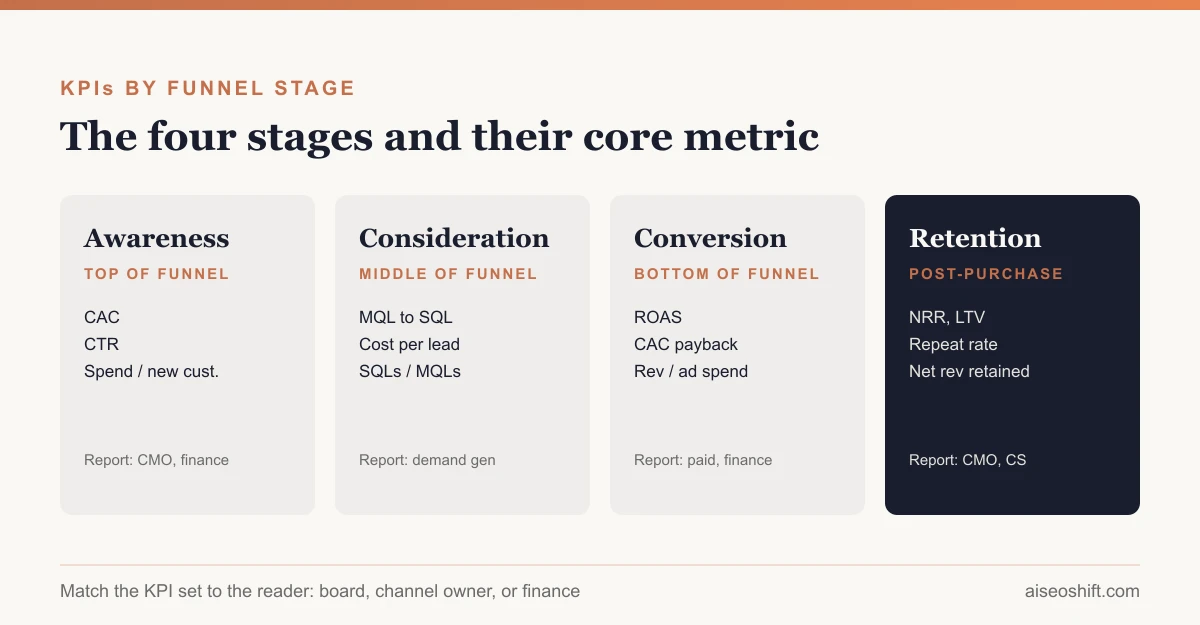
Every funnel has four real stages for measurement purposes, whatever you call them internally: awareness, consideration, conversion, and retention. Each stage has its own KPI, its own formula, and its own audience.
| Funnel stage | KPI | Formula | Who reports on it |
|---|---|---|---|
| Awareness | Customer acquisition cost (CAC) | Total sales + marketing spend ÷ new customers acquired | CMO, finance |
| Awareness | Click-through rate (CTR) | Clicks ÷ impressions | Channel manager |
| Consideration | MQL-to-SQL conversion rate | SQLs ÷ MQLs | Demand gen lead, sales ops |
| Consideration | Cost per lead (CPL) | Spend ÷ leads generated | Channel manager |
| Conversion | Conversion rate | Conversions ÷ sessions (or MQLs, or SQLs, depending on stage) | Growth marketer, CRO lead |
| Conversion | Return on ad spend (ROAS) | Revenue from ads ÷ ad spend | Paid media lead, finance |
| Conversion | Customer acquisition cost payback period | CAC ÷ (monthly recurring revenue per customer x gross margin) | Finance, SaaS marketing lead |
| Retention | Net revenue retention (NRR) | (Starting revenue + expansion - churn) ÷ starting revenue | CMO, customer success |
| Retention | Repeat purchase rate | Customers with 2+ orders ÷ total customers | Ecommerce marketing lead |
| Retention | Customer lifetime value (LTV) | Average order value x purchase frequency x customer lifespan | Finance, CMO |
For the question of what counts as a healthy number for any of these, see our breakdown of what counts as a good ROAS, since “good” depends entirely on margin and category.
KPIs by business model
The same funnel produces a different KPI set depending on what you are selling.
Ecommerce
Ecommerce has a short, self-serve purchase cycle, so the KPIs skew toward immediate transaction economics:
- ROAS by channel and by campaign, not just blended.
- Average order value (AOV): total revenue ÷ number of orders.
- Repeat purchase rate: customers with two or more orders ÷ total customers.
- Cart abandonment rate: abandoned carts ÷ total carts initiated.
- Email/SMS revenue share: revenue attributed to owned channels ÷ total revenue.
SaaS
SaaS has a longer sales cycle and a subscription revenue model, so the KPIs track acquisition efficiency against lifetime value:
- CAC payback period: months it takes a new customer’s gross margin to cover their acquisition cost.
- MQL-to-SQL and SQL-to-opportunity conversion rates.
- Net revenue retention (NRR): whether existing customers are expanding or shrinking your revenue base.
- LTV:CAC ratio: lifetime value divided by acquisition cost, with 3:1 generally treated as the healthy floor.
- Trial-to-paid conversion rate for product-led growth motions.
Lead gen (services, local, B2B without self-serve checkout)
Lead gen businesses care most about what happens between the click and the handoff to sales:
- Cost per lead (CPL) and cost per qualified lead (CPQL), which are not the same number and get mixed up constantly.
- Lead-to-appointment rate and appointment-to-close rate.
- Marketing-sourced pipeline, as a share of total pipeline, which HubSpot and most RevOps teams benchmark in the 30 to 50% range for a marketing function that is pulling its weight.
- Time to first response, since speed-to-lead is one of the few variables that correlates directly with close rate in lead gen.
Which KPIs to report to whom
The CEO does not want the same report as the paid social manager, and sending them the same dashboard is why most marketing reporting gets ignored.
| Audience | What they need | Cadence |
|---|---|---|
| CEO / board | Marketing-sourced revenue, CAC trend, LTV:CAC ratio | Monthly or quarterly |
| CMO / VP Marketing | All of the above, plus channel mix, MQL-to-SQL rate, retention | Weekly |
| Channel manager (paid, email, social) | CTR, CPL, ROAS, CPA by campaign | Daily or weekly |
| Sales leadership | MQL-to-SQL conversion, lead-to-appointment rate, marketing-sourced pipeline | Weekly |
| Finance | CAC, CAC payback period, LTV, marketing spend against budget | Monthly |
A board member does not need to know your Instagram reach. A paid social manager does need to know it, because it is a diagnostic input to why CTR moved. Same number, different report.
Vanity metrics to drop
These show up on dashboards constantly and almost never drive a decision:
- Impressions, without a CTR or conversion number next to them.
- Follower count, growth of which does not reliably predict revenue.
- Raw website traffic, unless segmented by source and tied to conversion.
- Email list size, without open rate, click rate, or revenue per subscriber attached.
- “Engagement” as a single blended number across likes, comments, and shares with no weighting.
None of these are useless as diagnostics. They are useless as headline KPIs, because nobody changes a budget or a campaign based on follower count alone.
How often to review each KPI
Not every KPI needs the same review cadence, and checking a slow-moving metric daily just creates noise that looks like signal.
- Daily: CTR, CPL, ad spend pacing. These move fast and a campaign can overspend or underperform within 48 hours if nobody’s watching.
- Weekly: MQL-to-SQL conversion, ROAS by channel, email open and click rates. Enough data accumulates in a week to see a real trend rather than noise.
- Monthly: CAC, CAC payback period, repeat purchase rate, marketing-sourced revenue. These need a full sales or purchase cycle to mean anything, and checking them weekly just shows you sampling error.
- Quarterly: LTV, net revenue retention, channel mix shifts. These are strategic, not tactical, and reacting to a quarter-over-quarter wobble here usually does more harm than good.
A common failure mode is running the monthly-cadence metrics through a daily dashboard. CAC computed on three days of data is mostly noise, and teams that chase it end up making spend decisions off statistical static.
Common KPI tracking mistakes
Mixing attribution windows across channels. If your paid social platform reports a 7-day click attribution window and your analytics tool reports last-click at 30 days, your “ROAS” and your “conversion rate” are measuring two different things that happen to share a name. Standardize the window before you compare channels.
Reporting blended CAC without a channel breakdown. A blended CAC of $40 might hide a $15 CAC from email and a $90 CAC from a paid channel that’s quietly burning budget. The average tells you nothing actionable; the breakdown tells you where to cut.
Treating MQL volume as a KPI on its own. A pile of MQLs that never converts to SQLs is not progress, it’s a sign the lead-scoring criteria are too loose or marketing and sales disagree on what counts as qualified.
Changing the KPI definition mid-quarter. If CAC includes agency fees in January and excludes them in March, the trend line is lying to you. Lock the formula at the start of a reporting period and note any change clearly when it happens.
Where these numbers actually live
Most teams don’t have one tool that shows every KPI in this article, and trying to force one is usually a waste of a quarter. A more realistic setup:
- Ad platform dashboards (Meta Ads Manager, TikTok Ads Manager, Google Ads) for CTR, CPM, and platform-reported ROAS, with the caveat that platform-reported numbers tend to run optimistic versus your own analytics.
- A web analytics tool (GA4 or similar) for traffic, conversion rate, and source-level attribution.
- Your CRM or billing system for CAC, LTV, NRR, and anything tied to actual revenue, since this is the one source that reflects what was really charged rather than what a pixel reported.
- A BI layer or spreadsheet that pulls from all three, which is usually where the CEO-level dashboard actually lives, because no single platform tool shows CAC next to repeat purchase rate next to blended ROAS.
The spreadsheet or BI layer is the one that matters most and gets built last. Build it earlier than feels necessary; reconciling three disconnected dashboards during a board meeting is a bad place to discover your CAC definition doesn’t match finance’s.
A worked example
Say you run a $45 skincare brand doing $80,000 a month in revenue through paid social and email. Your CMO dashboard for the month might look like this:
| KPI | This month | Last month | Target |
|---|---|---|---|
| Blended ROAS | 2.8x | 2.4x | 3.0x |
| CAC | $38 | $42 | $35 |
| Repeat purchase rate | 24% | 21% | 30% |
| Email revenue share | 18% | 15% | 20% |
Every number here points to a decision: ROAS is improving but still under target, so paid spend stays flat rather than scaling. CAC dropped, which is good, but repeat purchase rate moving from 21% to 24% is the number actually worth investigating, because a retention lift of a few points compounds faster than another point of ROAS. That is the kind of read a KPI table should give you in under a minute. For the email revenue share line specifically, the platform you’re running email through matters: our comparison of Klaviyo vs. Mailchimp covers which one reports revenue attribution more accurately out of the box.
The bottom line
Pick the KPI set that matches your business model, not a generic “marketing dashboard” template. Put CAC, your main conversion rate, marketing-sourced revenue, and retention in front of leadership. Keep the diagnostic metrics, CTR, CPL, email open rate, for the channel owners who need them to explain the top-line numbers. And cut anything from the report that would not change a single decision if it doubled overnight.
For the KPIs specific to email programs, see our guide to email marketing for small businesses, and for attribution modeling questions behind these numbers, see our piece on marketing mix modeling.
Related guides
- How to Build a Full-Funnel Performance Marketing System (Step-by-Step, 2026)
- Marketing Budget Allocation: A Practical Framework for 2026
- Marketing Attribution Models: A Practical Guide for 2026
- LTV:CAC Ratio: Formula, Benchmark and Worked Examples