Playbooks
How to Improve Conversion Rate: A Prioritized Process
Most conversion rate advice is a list of 50 generic tips. The actual skill is picking which five to test first, and knowing how long to wait before trusting the result.

Improving conversion rate is not a list of fixes to apply in order. It is a process: find where people are actually dropping off, form a specific hypothesis about why, rank the ideas by how much they could matter, and test in a way that actually tells you something. Skip the process and run straight to “make the button bigger” and you will ship a lot of changes that do nothing measurable.
Key takeaways
- Start with research (funnel drop-off, session recordings, surveys), not a generic checklist.
- Score hypotheses with ICE (Impact, Confidence, Ease) so the test most likely to pay off runs first.
- Sample size depends on your baseline conversion rate and the lift size you want to detect; low-traffic pages need a bigger expected effect to resolve in a reasonable time.
- Group fixes by page type (landing page, product page, checkout, forms) since the highest-impact change differs by page.
- A test called early on a flicker of significance is usually a false positive, not a win.
The process, before any specific fix
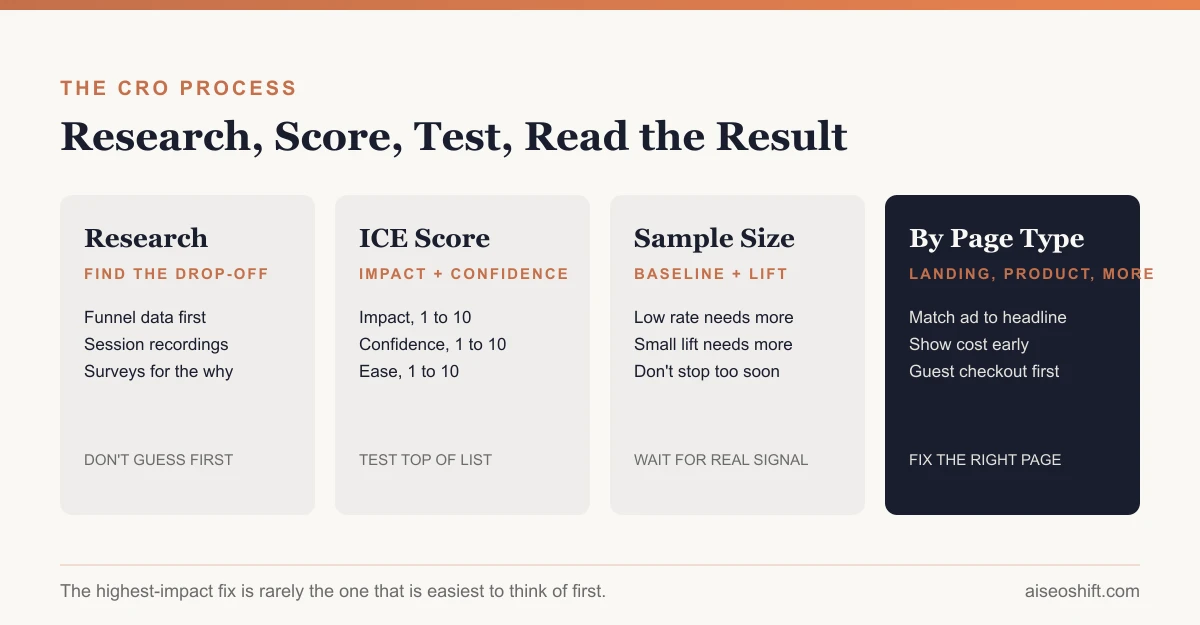
1. Research before you guess
Three sources tell you where to look, in order of how fast they are to get:
- Funnel data. Where does the biggest percentage of people actually leave? This is usually the single most useful number you have and the most skipped step, because it is tempting to jump straight to opinions about design.
- Session recordings. Watch real visitors hit the step where drop-off is highest. Rage clicks, hesitation, and people scrolling past the thing you assumed they would see are all visible here in a way a spreadsheet cannot show.
- On-site surveys and support tickets. What are people actually asking or complaining about right before they leave. This is slower to collect but often the only source that explains the “why” behind a drop-off the other two just confirm exists.
2. Write a specific hypothesis
“Improve the checkout page” is not a hypothesis. “Shoppers abandon at the shipping cost step because the cost is not shown until this point, so showing estimated shipping on the product page will reduce abandonment at checkout” is one. A specific hypothesis tells you exactly what to build and exactly what result would prove it right or wrong.
3. Score with ICE, then test in order
| Factor | Question | Score 1-10 |
|---|---|---|
| Impact | How much could this move the target metric if it works? | |
| Confidence | How sure are you, based on data, user feedback or precedent elsewhere? | |
| Ease | How fast and cheap is it to build and ship? |
Multiply or average the three scores per idea, rank the list, and test from the top down. This is the single biggest difference between teams that improve conversion rate steadily and teams that run a test a quarter on whatever a stakeholder pushed for. It is not a complicated framework. Most teams just do not use it consistently.
4. Know your sample size before you start
The required sample size depends on two things: your current baseline conversion rate, and the smallest lift you need to be able to detect reliably. A page converting at 2% needs more total visitors to reliably detect a given lift than a page converting at 20%, because rare events need more observations to measure precisely. A test chasing a 2% lift needs a much bigger sample than one chasing a 20% lift, because small effects are harder to separate from normal day-to-day noise.
The practical consequence: do not run a precision test on a page that gets a trickle of traffic. If a landing page gets 300 visitors a month, testing a subtle headline tweak there will take forever to resolve. Test something with a bigger expected effect on that page, or move the precision test to a higher-traffic page instead.
The other practical trap is stopping a test the moment it first shows significance. Significance can cross the threshold and drop back below it multiple times before a test has run long enough, especially in the first few days. Decide your required sample size or run time before launching the test, and do not peek-and-stop the first time the number looks good.
15 fixes, grouped by page type
Not every fix belongs on every page. These are grouped so you are testing the thing most likely to matter for that specific page’s job.
| Page type | Fix | Why it tends to matter |
|---|---|---|
| Landing page | Match headline to the exact ad or email that sent the click | Message mismatch between ad and page is one of the most common silent killers of landing page conversion |
| Landing page | Move the primary CTA above the fold | People decide whether to keep scrolling in the first few seconds |
| Landing page | Cut form fields to the minimum needed | Every extra field is a chance to abandon |
| Landing page | Add one specific proof point near the CTA, not a wall of logos | A specific number or detail reads as more credible than a generic trust badge row |
| Landing page | Make the page load fast on mobile specifically | Mobile visitors abandon slow pages faster than desktop visitors do |
| Product page | Show real product images from multiple angles, not just the hero shot | Reduces the uncertainty that stops a purchase |
| Product page | Put shipping cost and delivery estimate near the price, not hidden until checkout | Surprise costs at checkout are a well-documented abandonment trigger |
| Product page | Answer the top three pre-purchase questions on the page itself | Fewer tab-switches to search for the answer means fewer lost sessions |
| Product page | Show stock level or urgency only when it is true | A fake countdown or fake low-stock warning erodes trust once noticed |
| Checkout | Offer guest checkout as the default, not account creation first | Forcing an account before purchase is a common and avoidable drop-off point |
| Checkout | Show a progress indicator across steps | Reduces the feeling of an open-ended process |
| Checkout | Surface payment and security trust marks near the payment field | This is where hesitation about entering card details peaks |
| Forms | Group related fields and label them clearly | Reduces perceived effort even when the actual field count does not change |
| Forms | Validate fields inline, not only after submit | Catching an error immediately is less frustrating than a full-page reload with an error at the top |
| Forms | Make the submit button describe the outcome, not just say “Submit" | "Get my quote” or “Start my trial” sets expectation better than a generic label |
Tools, picked by what they tell you
| Tool category | What it is for |
|---|---|
| Analytics (GA4, Mixpanel) | Funnel drop-off, where people leave |
| Session recording/heatmaps | Watching real behavior at the point of drop-off |
| A/B testing platform | Running the actual test and reading statistical results |
| On-site survey/feedback widget | The “why,” direct from visitors |
| Page speed testing | Ruling out load time as a hidden cause before testing anything else |
Worked example
Say a $35 supplement brand finds, through funnel data, that 40% of visitors who add the product to cart never reach the shipping step, more than any other single drop-off point on the site. A session recording review shows several visitors scrolling up and down at the cart page, which suggests confusion rather than clear abandonment. A support ticket search turns up a handful of questions asking whether the product ships internationally, something the cart page does not mention.
The hypothesis: cart-stage abandonment is partly driven by unanswered shipping questions, and adding a visible shipping and returns line to the cart page will reduce it. ICE score: Impact 8 (40% is the largest single drop-off point found), Confidence 6 (support tickets suggest this but do not prove it is the main cause), Ease 9 (a one-line addition to an existing page). That combination puts this test ahead of a planned homepage redesign that scored lower on confidence and much lower on ease. The test runs until it reaches the sample size needed to detect a meaningful change in cart-to-checkout progression, not until the first day it looks promising.
For the specific mechanics of reducing drop-off once someone has actually reached checkout, see our guide to checkout optimization. For landing-page-specific fixes beyond what fits in the table above, landing page best practices goes deeper on structure and copy. And if ecommerce is your context specifically, our ecommerce conversion rate guide covers benchmarks and fixes particular to online stores. If your biggest lever right now is actually the quality of traffic reaching these pages rather than the pages themselves, our guide to Performance Max campaigns and our marketing KPIs breakdown are both worth checking before you assume the page is the problem.
The bottom line
Conversion rate optimization is a research and prioritization discipline wearing a testing-tool costume. The fixes in the table above work, but only on the right page, in the right order, tested long enough to trust the result. Skip the research step and you are guessing with extra steps. Skip the sample-size step and you are shipping changes based on noise.
Related guides
- Best Trending Product Research Tools in 2026: 14 Ways to Find Products Before They Peak
- LinkedIn Marketing Strategy: Pages, Posting and Ads That Work
- How to Build a Full-Funnel Performance Marketing System (Step-by-Step, 2026)
- The Marketing Plan Template to Copy for 2026 (Free)